Mobile vs. Desktop Usability: Booking and Enquiry Benchmarks (2026)
Revamp’s 2026 booking and enquiry benchmarks: 4,584 mobile and desktop task attempts across 48 US service-business websites, with times and form errors.
Introduction
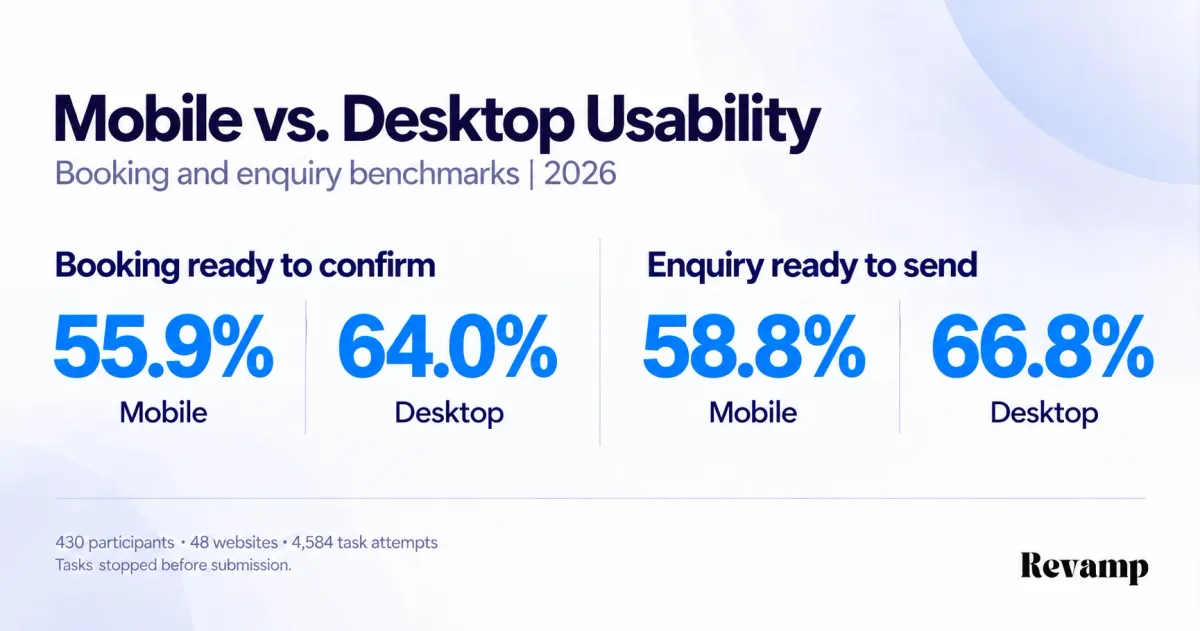
Bookings and enquiries were more often ready to confirm on desktop than on mobile. In Revamp’s usability study, 64.0% of desktop booking attempts reached that point, compared with 55.9% on mobile. For enquiries, the rates were 66.8% and 58.8%, respectively. Desktop led by about eight percentage points for both task types.
Our internal study covered 4,584 task attempts by 430 participants across 48 US service-business websites in June–July 2026. Participants attempted the same website tasks on both devices. See the methodology.
All tasks stopped before submission. Success meant that the required fields were accepted and the booking or enquiry was ready to confirm. It did not mean that the business received a booking or lead.
Key Takeaways
- Booking preparation: 579 of 1,036 mobile attempts met the completion criteria, compared with 663 of 1,036 desktop attempts. Desktop led by 8.1 percentage points.
- Enquiry preparation: 738 of 1,256 mobile attempts met the criteria, compared with 839 of 1,256 desktop attempts. Desktop led by 8.0 percentage points.
- Booking task time: among successful attempts, the median was 5 minutes 24 seconds on mobile, versus 3 minutes 30 seconds on desktop.
- Enquiry task time: the corresponding medians were 3 minutes 9 seconds on mobile and 2 minutes 11 seconds on desktop.
- Recorded validation errors: at least one error appeared in 54.6% of mobile booking attempts, compared with 33.5% on desktop.
All percentages describe attempts in this dataset. Multiple attempts came from the same participants and websites.
Explore the benchmarks
- Preparation rates
- Time on task
- Where the journeys diverged
- Validation errors
- Industry differences
- Methodology and limitations
- Frequently asked questions
1. More bookings and enquiries were ready to confirm on desktop
Desktop had a higher success rate for both tasks, with a similar gap for bookings and enquiries.
| Task | Device | Attempts | Ready-to-confirm attempts | Rate |
|---|---|---|---|---|
| Booking | Mobile | 1,036 | 579 | 55.9% |
| Booking | Desktop | 1,036 | 663 | 64.0% |
| Enquiry | Mobile | 1,256 | 738 | 58.8% |
| Enquiry | Desktop | 1,256 | 839 | 66.8% |
The desktop advantage was 8.1 percentage points for booking and 8.0 points for enquiry, calculated from the unrounded counts. That is roughly eight more ready-to-confirm attempts per 100 attempts in each task group.
What happened to the other attempts?
The dataset distinguishes preparation success from reaching the final step without confirmed completion. It also separates exits, voluntary abandonment, timeouts and unknown outcomes.
| Recorded outcome | Booking mobile | Booking desktop | Enquiry mobile | Enquiry desktop |
|---|---|---|---|---|
| Ready to confirm | 579 | 663 | 738 | 839 |
| Final step reached; completion unconfirmed | 84 | 104 | 124 | 166 |
| Voluntary abandonment | 152 | 103 | 160 | 81 |
| Observed exit | 115 | 107 | 125 | 93 |
| Timeout | 80 | 42 | 75 | 63 |
| Unknown outcome | 26 | 17 | 34 | 14 |
| Total attempts | 1,036 | 1,036 | 1,256 | 1,256 |
An unknown outcome is not evidence of failure. Likewise, a session reaching its time limit does not prove that a customer would have voluntarily left at that moment. The headline rate uses all eligible attempts as its denominator, while retaining these distinctions.
2. Successful booking preparation took longer on mobile
Successful mobile booking preparation had a median duration of 5 minutes 24 seconds, compared with 3 minutes 30 seconds on desktop. That is a difference of 1 minute 54 seconds between the group medians.
| Task | Device | Successful attempts timed | Median | 25th–75th percentile |
|---|---|---|---|---|
| Booking | Mobile | 579 | 5m 24s | 3m 39s–7m 44s |
| Booking | Desktop | 663 | 3m 30s | 2m 26s–4m 55s |
| Enquiry | Mobile | 738 | 3m 09s | 2m 12s–4m 37s |
| Enquiry | Desktop | 839 | 2m 11s | 1m 32s–3m 05s |
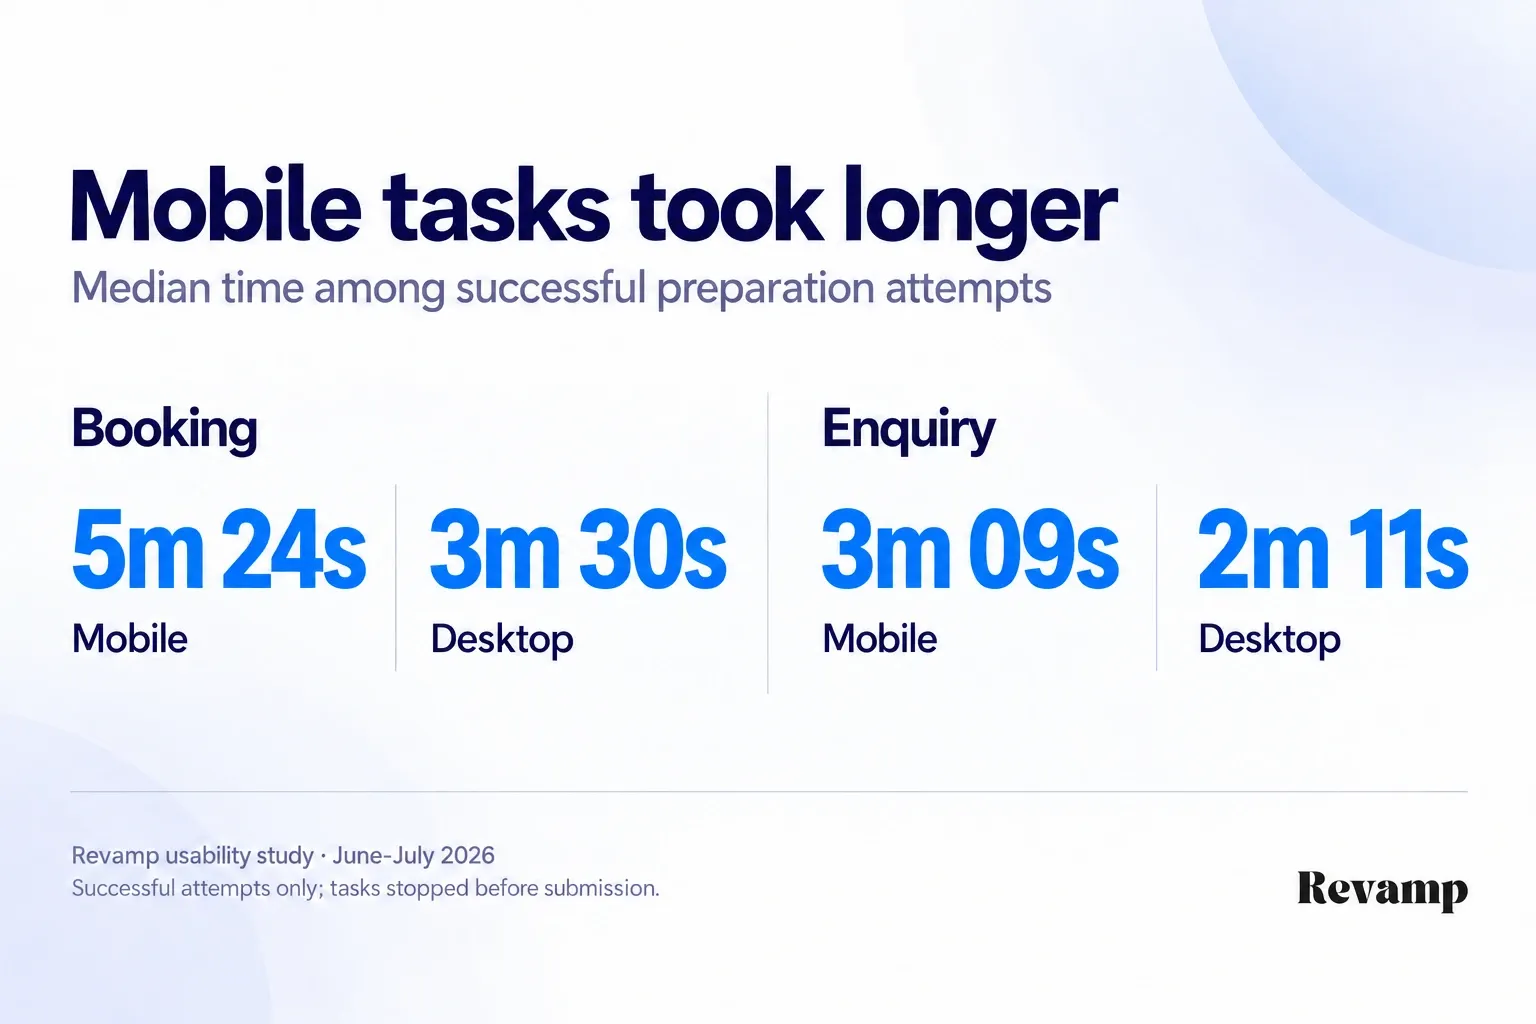
Among successful attempts, the gap between device medians was 114 seconds for booking and 58 seconds for enquiry. Booking involved service and appointment selection as well as form preparation, giving businesses more stages to examine when reviewing the mobile experience.
The middle half of successful mobile booking attempts took between 3 minutes 39 seconds and 7 minutes 44 seconds. Read these times alongside the success rates: they describe completed preparation tasks, not everyone who tried.
3. Where Mobile and Desktop Journeys Diverge
The descriptive funnel shows smaller device differences early in the task and larger differences around form preparation.
| Milestone | Booking mobile | Booking desktop | Enquiry mobile | Enquiry desktop |
|---|---|---|---|---|
| Started journey | 100.0% | 100.0% | 100.0% | 100.0% |
| Reached service-selection step | 95.3% | 97.3% | 97.0% | 98.2% |
| Started form | 76.2% | 85.8% | 89.5% | 93.8% |
| Completed form-entry step | 70.3% | 79.3% | 80.7% | 88.9% |
| Ready to confirm | 55.9% | 64.0% | 58.8% | 66.8% |
Every percentage uses all attempts in its task/device group as the denominator. These are cumulative reach rates, not conversion rates between adjacent steps.
For booking, the desktop–mobile gap was about two points at service selection and roughly ten points at form start. For enquiry, the gap was about one point at service selection and about eight points at form completion.
That identifies stages worth investigating. It does not prove that form design caused the overall difference: availability, device familiarity, repeated-task learning and other conditions may also contribute.
4. Form validation errors were more common on mobile
| Task | Mobile attempts with errors | Desktop attempts with errors |
|---|---|---|
| Booking | 566/1,036 (54.6%) | 347/1,036 (33.5%) |
| Enquiry | 646/1,256 (51.4%) | 428/1,256 (34.1%) |
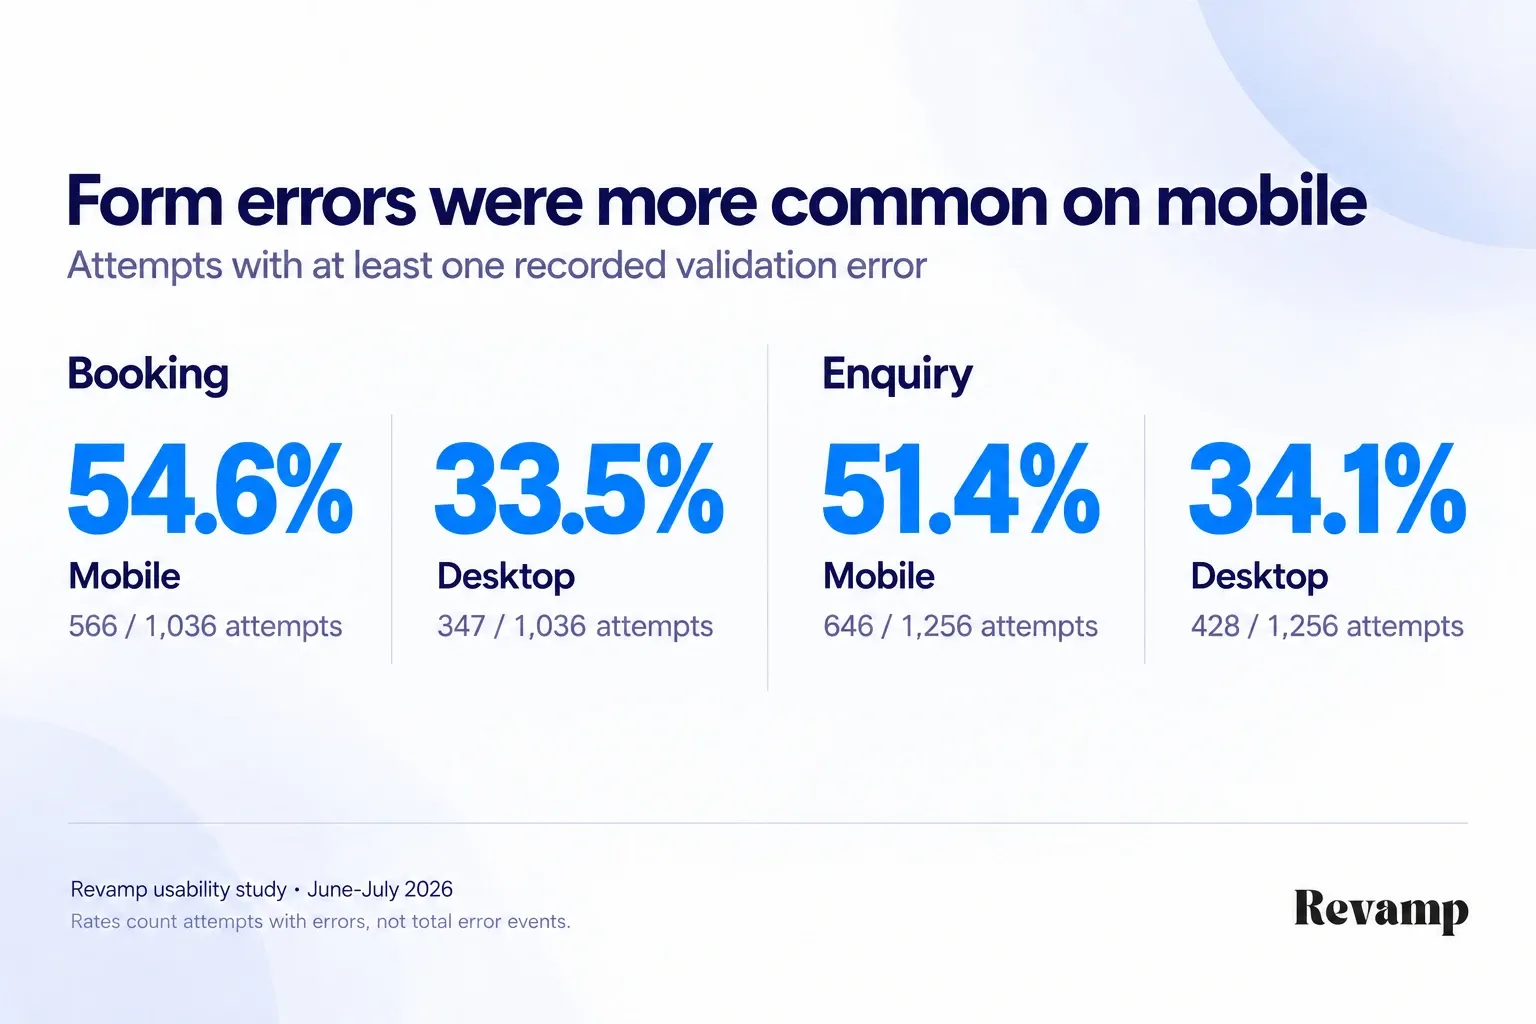
Mobile booking attempts were more likely to show a validation error: 54.6%, compared with 33.5% on desktop. The gap was 21.1 percentage points for booking and 17.4 points for enquiry, calculated from the underlying counts.
These figures count attempts with at least one recorded error. They do not count the total number of errors or abandoned tasks. To identify useful changes, examine which fields fail and whether users can correct them without losing their work.
5. The device gap varied by industry
The overall desktop advantage masked substantial differences between the selected industry groups.
| Task and industry | Mobile | Desktop | Attempts per device |
|---|---|---|---|
| Health and dental · booking | 52.4% | 72.4% | 185 |
| Home and trade services · booking | 59.8% | 61.6% | 229 |
| Hospitality · enquiry | 63.1% | 58.4% | 149 |
Health and dental bookings showed a 20-point desktop advantage, while home and trade services had a much smaller gap. Hospitality enquiries went in the other direction, with a higher mobile success rate.
These smaller subgroups provide context rather than an industry ranking. Repeated attempts within a limited set of businesses and participants make the overall sample more useful as a starting point for investigation.
What These Findings Mean for Businesses
Review the whole task your customer needs to complete. A mobile homepage that looks correct is only the beginning of a booking or enquiry journey.
For booking flows, start with the transition from service selection to the form. The desktop–mobile gap widened from about two percentage points at service selection to roughly ten points at form start. Review that transition on both devices, including date selection and the action that opens the form. This identifies where to investigate, not what caused the gap.
For enquiries, inspect field validation and recovery. More than half of mobile attempts recorded an error. Check whether messages are visible, instructions are clear, and previously entered information survives a correction. After making changes, repeat the same task on both devices.
Use these benchmarks as context for an investigation, rather than a forecast for your business. To measure actual customer outcomes, track confirmed submissions separately and compare equivalent traffic and reporting periods.
Methodology and Sources
Source: Revamp’s internal usability study. This article reports anonymized, aggregate results; participant and website identities are not disclosed.
Revamp’s internal usability study ran from June 1 to July 31, 2026, involving 430 participants and 48 US service-business websites. The screening register includes 59 websites, of which 11 were excluded for lacking a suitable online journey.
The analysis contains 2,292 mobile–desktop pairs, or 4,584 attempts. Booking accounts for 1,036 pairs across 40 websites; enquiry accounts for 1,256 pairs across 48 websites. Each pair links the same participant, website and task across devices. Device order was randomized, as recorded in the study export.
The tasks stopped before submission. Booking required selecting a service and an appointment slot and preparing the final review step. Enquiry required finding the correct route and preparing a ready-to-send form. Payment, verification and untracked third-party steps were outside the measured endpoint.
The same people repeated tasks across devices, creating a possible learning effect. Multiple pairs also share participants and websites. The counts therefore must not be interpreted as thousands of independent customers or as a representative sample of all US business websites.
Rates are descriptive proportions from the internal attempt records. Timing begins at page-load start and includes only successful attempts, with inclusive percentile calculations. The 25th–75th percentile range describes the middle half of durations, not uncertainty around the median. Differences between device medians are not the median of individual paired differences.
All headline rates pool attempts within each task/device group. Giving each website equal weight yields booking rates of 55.7% mobile versus 64.2% desktop, and enquiry rates of 58.6% versus 66.6%. Validation-error recording depended on the website revealing the error, so uncaptured errors may exist. Unknown outcomes are reported separately. The recorded limits were 15 minutes for booking and 10 minutes for enquiry.
Revamp conducted the study and also offers website creation and redesign services. That commercial interest should be considered when interpreting the study.
Frequently asked questions
Did desktop have a higher preparation rate than mobile?
In Revamp’s internal study, yes. Booking preparation was 64.0% on desktop and 55.9% on mobile; enquiry preparation was 66.8% and 58.8%. These are descriptive results for the tested sample.
Are these booking conversion rates?
No. The tasks stopped before submission. Preparing a booking is different from completing one, and a ready-to-send enquiry is different from a lead received by the business.
How much longer did mobile booking preparation take?
Among successful attempts, the mobile median was 5 minutes 24 seconds and the desktop median was 3 minutes 30 seconds. The difference between those medians is 1 minute 54 seconds.
Can these figures predict the benefit of redesigning my website?
No. The study did not measure before-and-after redesign outcomes. Your results depend on your website, customers and the changes made.
Why keep unknown outcomes separate?
Because missing confirmation does not establish what happened. Counting every unknown as abandonment would confuse incomplete evidence with an observed decision to leave.
Build what your business needs. Keep improving it.
- Start with your existing website or create something new from your idea
- Add pages, forms, bookings, payments and other business features by chatting
- Publish on your own domain and keep improving everything in one workspace
More Guides
Website First-Impression Statistics: 500-Person Study (2026)
Revamp's 2026 five-second study of 500 US participants and 50 pre-redesign business homepages: business recognition, offer comprehension and CTA recall.
Website Trust Statistics: Design, Reviews & Contact (2026)
Website trust statistics from Revamp's internal analysis of 2,367 page ratings. Compare design, reviews and contact details, with methods and limitations.
Website Redesign Conversion Statistics: 22-Business Study (2026)
13.5% higher recorded conversion rates after redesign: website redesign conversion statistics from 496,781 visitors across 22 service businesses.