Website Redesign Conversion Statistics: 22-Business Study (2026)
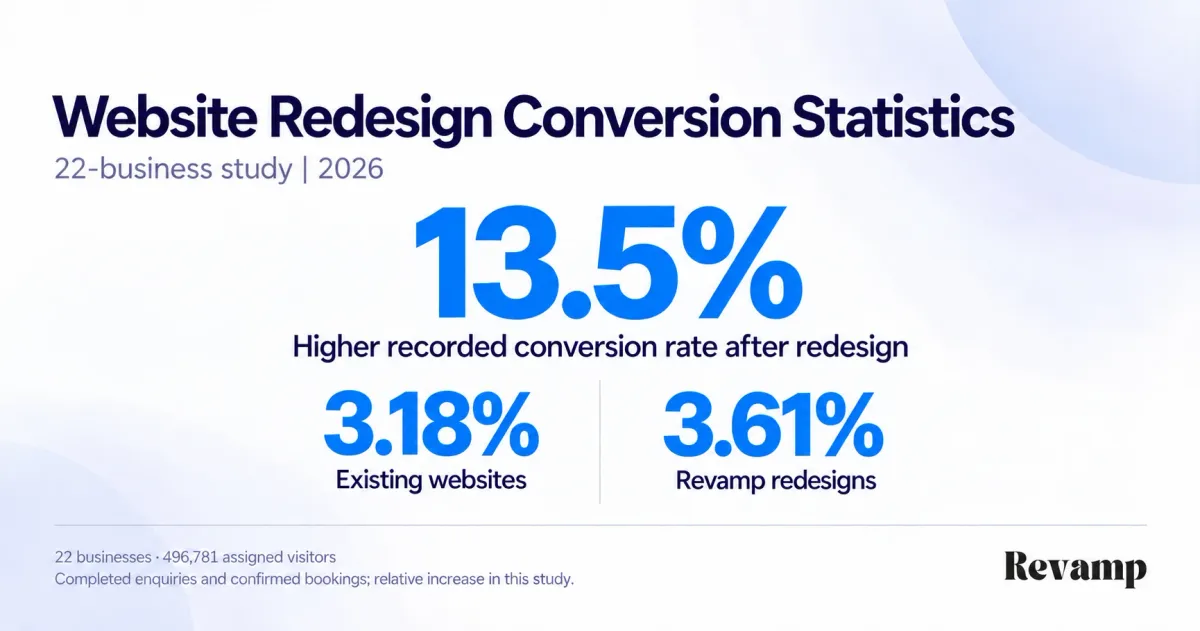
13.5% higher recorded conversion rates after redesign: website redesign conversion statistics from 496,781 visitors across 22 service businesses.
Introduction
13.5% higher recorded conversion rates on redesigned business websites. In Revamp’s 22-business study, the pooled conversion rate rose from 3.18% on existing websites to 3.61% on their redesigned versions. These website redesign conversion statistics cover 496,781 assigned visitors and 16,874 recorded enquiries or bookings.
Revamp’s internal study compared existing websites with their completed Revamp redesigns. The redesigns changed presentation, copy, navigation, forms and performance together. The question was whether more visitors completed the business’s defined next step, not simply whether a new page looked better or loaded faster.
The study measured completed enquiries and confirmed bookings during the observation period. Methodology and sources explain how outcomes were counted and results calculated.
Key Takeaways
- 13.5% higher recorded conversion rates: 3.61% on redesigns versus 3.18% on existing websites. The difference was 0.43 percentage points, or approximately four additional recorded outcomes per 1,000 visitors.
- Business-level results: 20 of 22 businesses had a higher recorded conversion rate on the redesigned version. Changes ranged from -2.4% to +34.4% relative.
- Completed enquiries: the recorded rate rose from 3.23% to 3.68%, a 14.0% relative increase across 20 businesses.
- Confirmed bookings: the recorded rate rose from 2.98% to 3.32%, an 11.2% relative increase across two businesses.
- Validation errors: recorded error events per 1,000 visitors were 56.5% lower on redesigned versions.
- The whole journey matters: the study compared complete redesigns, covering design, content, navigation, forms and speed together.
Explore the findings
- Overall conversion rates
- All 22 business results
- Enquiries and bookings
- Form starts and errors
- Mobile and desktop
- Industry differences
- Performance measurements
- Practical implications
- Methodology and sources
1. Redesigned websites recorded 13.5% higher conversion rates
The existing versions recorded 7,909 completed business outcomes from 248,536 assigned visitors. The redesigned versions recorded 8,965 from 248,245 visitors.
| Measure | Existing website | Revamp redesign |
|---|---|---|
| Assigned visitors | 248,536 | 248,245 |
| Visitors with a recorded confirmed outcome | 7,909 | 8,965 |
| Recorded conversion rate | 3.18% | 3.61% |
| Recorded outcomes per 1,000 visitors | 31.8 | 36.1 |
The difference was 0.43 percentage points. Dividing that difference by the existing-site rate gives the 13.5% relative increase: approximately four additional recorded enquiries or bookings per 1,000 visitors.
The traffic-weighted result gives larger websites more influence. Giving each business equal weight instead produces an average difference of 0.39 percentage points. Both summaries are positive, but they answer different questions: the pooled result describes the combined recorded traffic; the equal-weight result describes the average difference among these 22 businesses.
For a business owner, the relevant comparison is the rate at which visitors complete the same action on each version. More traffic alone can produce more enquiries without improving that rate.
2. Twenty of 22 businesses recorded higher conversion rates
Twenty businesses recorded a higher conversion rate on their redesigned version; two recorded a small decrease. Here are the results for all 22 businesses.
| Business | Industry | Existing rate | Redesign rate | Relative change |
|---|---|---|---|---|
| B01 | Legal services | 3.34% | 4.05% | +21.4% |
| B02 | Legal services | 5.33% | 5.47% | +2.5% |
| B03 | Legal services | 5.46% | 5.90% | +8.1% |
| B04 | Legal services | 3.27% | 4.06% | +24.0% |
| B05 | Legal services | 4.36% | 5.08% | +16.7% |
| B06 | Legal services | 4.63% | 4.52% | -2.4% |
| B07 | Accounting | 2.90% | 3.30% | +14.1% |
| B08 | Accounting | 2.46% | 3.10% | +25.9% |
| B09 | Accounting | 2.33% | 2.75% | +18.2% |
| B10 | Accounting | 2.97% | 3.09% | +4.2% |
| B11 | Accounting | 1.95% | 2.62% | +34.4% |
| B12 | Home improvement | 4.25% | 5.37% | +26.3% |
| B13 | Home improvement | 3.06% | 3.38% | +10.5% |
| B14 | Home improvement | 3.01% | 3.43% | +13.9% |
| B15 | Home improvement | 3.88% | 4.00% | +3.2% |
| B16 | Home improvement | 2.83% | 3.02% | +7.0% |
| B17 | Home improvement | 3.29% | 4.18% | +27.0% |
| B18 | Business consulting | 2.77% | 2.73% | -1.5% |
| B19 | Business consulting | 1.92% | 2.03% | +5.5% |
| B20 | Business consulting | 1.23% | 1.38% | +11.9% |
| B21 | Business consulting | 1.71% | 2.00% | +16.8% |
| B22 | Business consulting | 1.77% | 1.93% | +8.8% |
The largest relative increase was 34.4%, at accounting business B11. Results varied within each industry, making the individual business’s baseline and customer journey important context for the overall finding.
3. Enquiry and booking rates both moved upward
Twenty businesses used completed enquiries as their primary outcome. Two used confirmed bookings. Separating them avoids treating different customer actions as interchangeable.
| Primary outcome | Businesses | Existing outcomes / visitors | Redesign outcomes / visitors | Existing rate | Redesign rate | Relative change |
|---|---|---|---|---|---|---|
| Completed enquiry | 20 | 6,508 / 201,556 | 7,411 / 201,378 | 3.23% | 3.68% | +14.0% |
| Confirmed booking | 2 | 1,401 / 46,980 | 1,554 / 46,867 | 2.98% | 3.32% | +11.2% |
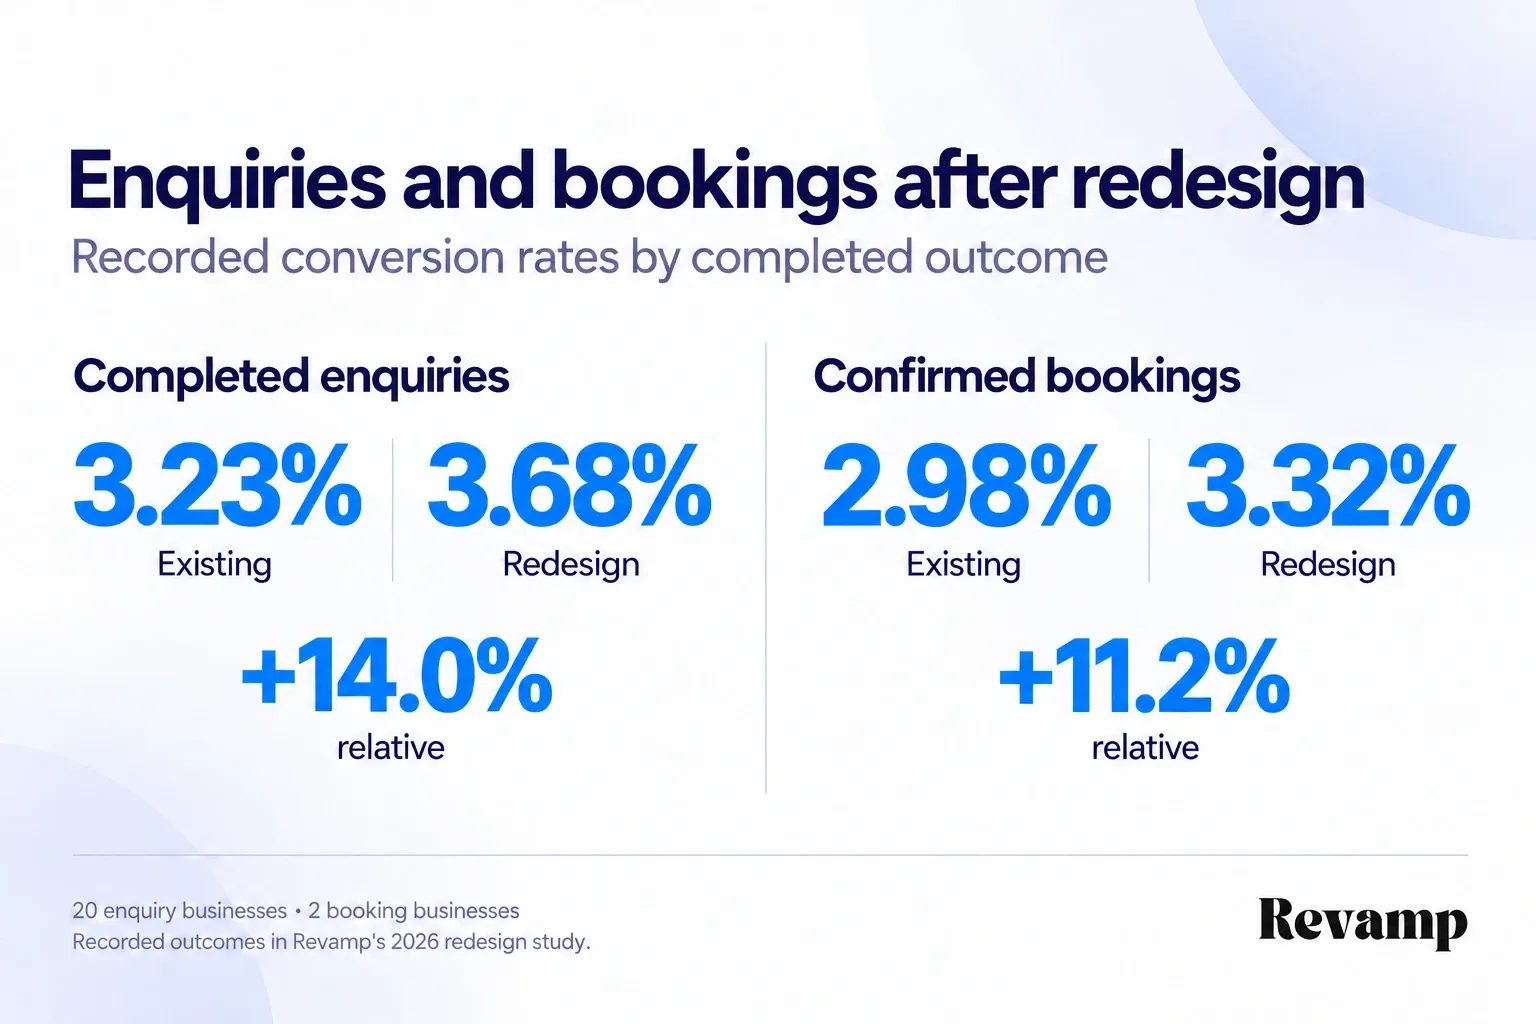
Both outcomes moved upward: 14.0% for completed enquiries and 11.2% for confirmed bookings. Measuring completion follows the action beyond the button, from opening a form to delivering an enquiry or confirming an appointment.
4. Redesigned versions recorded 56.5% fewer validation errors per visitor
The redesigns recorded more form or booking starts and fewer validation-error events. Comparing events per 1,000 assigned visitors accounts for the small difference in traffic between versions.
| Journey event | Existing events | Redesign events | Existing per 1,000 visitors | Redesign per 1,000 visitors |
|---|---|---|---|---|
| Enquiry or booking started | 20,204 | 22,782 | 81.3 | 91.8 |
| Validation error | 4,611 | 2,003 | 18.6 | 8.1 |
| Submission attempted | 17,352 | 19,680 | 69.8 | 79.3 |
| Confirmed outcome recorded | 7,909 | 8,965 | 31.8 | 36.1 |
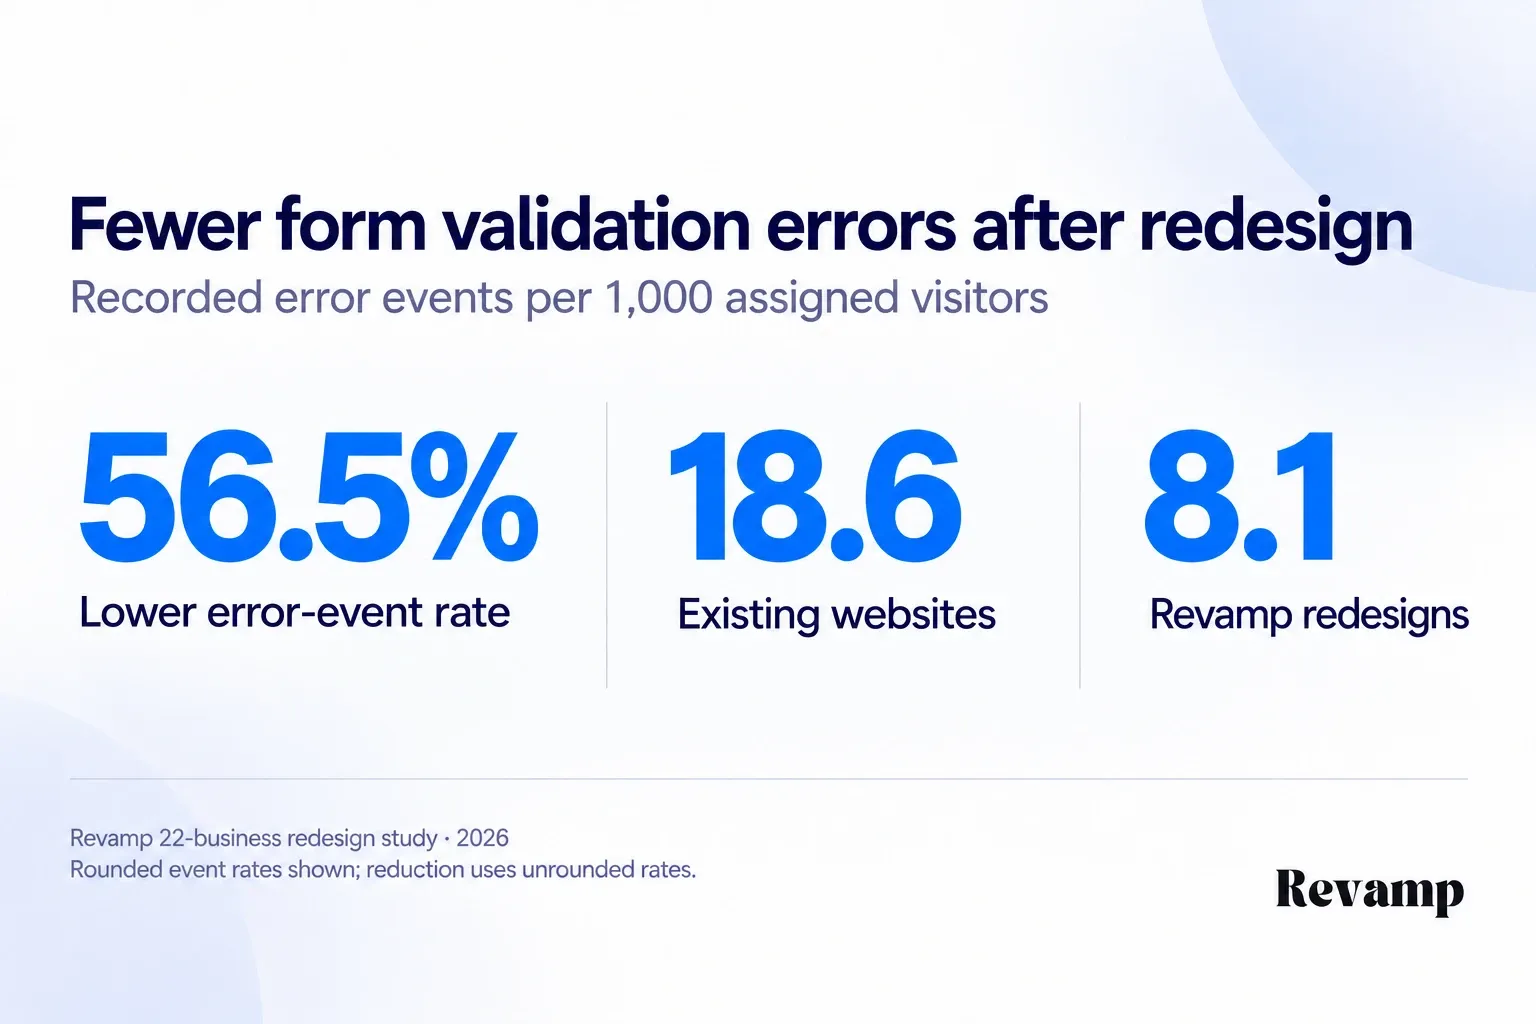
The 56.5% reduction uses unrounded error-event rates per 1,000 visitors. A journey can contain both an error and a completed submission; the table counts events at each step.
This pattern makes form usability worth checking during a redesign: clear field labels, understandable validation messages and a usable confirmation step.
5. Mobile and desktop recorded similar relative increases
Mobile accounted for 61.2% of assigned visitors. Both mobile and desktop had higher recorded conversion rates on redesigned versions.
| Device | Assigned visitors, both versions | Existing rate | Redesign rate | Relative change |
|---|---|---|---|---|
| Mobile | 303,784 | 3.44% | 3.91% | +13.5% |
| Desktop | 165,976 | 2.69% | 3.09% | +14.6% |
| Tablet | 27,021 | 3.26% | 3.54% | +8.8% |
The redesign comparison was positive across all three device groups. With mobile accounting for most visitors in this study, the phone experience deserves attention throughout the enquiry or booking journey.
Check the whole enquiry or booking journey on a phone, not only the homepage layout. A readable service page can still lead into a difficult form.
6. Recorded gains varied across service industries
All four industry groups had a positive pooled difference. Accounting and home improvement had the largest relative changes; consulting had the smallest.
| Industry | Businesses | Existing rate | Redesign rate | Relative change |
|---|---|---|---|---|
| Accounting | 5 | 2.60% | 3.00% | +15.5% |
| Home improvement | 6 | 3.40% | 3.91% | +14.9% |
| Legal services | 6 | 4.10% | 4.64% | +13.3% |
| Business consulting | 5 | 1.92% | 2.05% | +6.5% |
The consulting group started with the lowest conversion rate and recorded the smallest relative increase. The starting rate alone therefore tells only part of the story.
For planning, compare your website against its own recorded baseline and customer journey. A legal practice and a consulting firm may ask visitors to make very different commitments.
7. Performance improved alongside the redesign
The redesigned versions also had lower recorded loading, interaction-delay and layout-shift measurements. The figures below are the 75th percentiles of usable measurements in the supplied records.
| Recorded performance metric | Existing website | Revamp redesign |
|---|---|---|
| Largest Contentful Paint, seconds | 4.12 | 3.29 |
| Interaction to Next Paint, milliseconds | 299 | 157 |
| Cumulative Layout Shift | 0.18 | 0.07 |
Loading, responsiveness and layout stability all improved alongside changes to layout, copy, navigation and forms. The conversion comparison evaluates that complete redesign, rather than a faster copy of the old website.
What these website redesign statistics mean for business owners
A redesign should improve the journey from understanding the service to completing the next step. A modern appearance matters, but it is not the entire job.
- Choose the completed action before changing the website. Define whether success means an enquiry received, a booking confirmed or another business outcome. Keep that definition consistent.
- Review the service page and the next step together. Check the offer, navigation, contact options, form fields, error messages and confirmation. Do not stop at the homepage.
- Compare rates as well as totals. Record completed actions and visitors over comparable periods. Traffic growth and conversion improvement are not the same thing.
- Keep lead quality separate. An enquiry count cannot tell you whether the requests were relevant, profitable or ultimately won. Track those outcomes in the business’s own records.
Our website redesign guide covers planning, launch checks and ongoing measurement for the complete customer journey.
For the work involved in creating and later editing a website, see our AI vs. manual website building statistics. Build time and visitor conversion are different outcomes, measured in separate studies.
Methodology and Sources
Study scope
Revamp conducted and funded this internal study, comparing existing business websites with completed Revamp redesigns. The documented design assigned visitors approximately 50/50 within each business and kept their assigned version consistent. Businesses came through direct invitation or agency referral, not a representative random sample of all businesses.
| Study characteristic | Analysis scope |
|---|---|
| Businesses | 22 service businesses |
| Service categories | Legal services, accounting, home improvement, business consulting |
| Markets recorded | Australia, Canada, Germany, Ireland, Netherlands, United Kingdom, United States |
| Assignment timestamps in the records, UTC | February 18 to May 14, 2026 |
| Reanalysis | October 2026 |
| Assigned visitors | 496,781 |
| Visitors with a recorded confirmed outcome | 16,874 |
| Comparison | Existing website versus completed Revamp redesign |
| Primary outcome per business | Completed enquiry or confirmed booking |
Revamp conducted this study across 22 service businesses. Results are reported in aggregate, with business identities anonymized. The analysis uses the study’s assignment, session, event, outcome and performance records.
Outcome calculation
Recorded conversion rate equals assigned visitors with at least one recorded confirmed primary outcome divided by all assigned visitors in that version. Visitors count once per business. Assignment, session, event and outcome joins were checked; all recorded confirmations fall within 30 days of assignment.
The observation records end in May. The analysis measures confirmations captured during collection, with incomplete 30-day follow-up for late-assigned visitors. Later or unrecorded conversions are outside the measured endpoint.
The outcome table supplies counted confirmations. Confirmation-event membership agrees, while timestamps differ for 16,870 records, so confirmation timing is excluded from the findings. Visitors count once regardless of duplicate flags. The endpoint is confirmation, before any later cancellation, attendance or sale.
Uncertainty and tracking checks
We recalculated all rates from unrounded counts. For an exploratory estimate of between-business uncertainty, we resampled the 22 businesses with replacement 10,000 times, retaining each business’s two versions together. The seed was 20261004; intervals use the 2.5th and 97.5th percentiles.
| Summary | Observed estimate | Estimated 95% business-resampling interval |
|---|---|---|
| Pooled relative change | +13.5% | +9.1% to +17.7% |
| Equal-weight average business difference | +0.39 percentage points | +0.27 to +0.53 percentage points |
The intervals estimate variation across the recorded business results. They were calculated retrospectively and remain conditional on the recorded outcomes; missing outcomes and routing errors are outside their scope.
Session tracking was marked complete for 490,248 visitors (98.7%), partial for 5,481 and missing for 1,052. Restricting the analysis to complete-tracking records produced a 13.6% relative difference, compared with 13.5% across all assignments.
An extreme missing-outcome sensitivity check assigns every unrecorded outcome in incomplete-tracking records to one version or the other. It gives a difference range of -0.84 to +1.70 percentage points. This is a sensitivity bound, not a confidence interval, and covers only records flagged for incomplete tracking.
All supplied assignments are included because individual exclusion flags for the logged routing incidents were unavailable. Original observation values were preserved.
Interpretation
The findings describe complete redesigns, with design, speed, copy and forms changed together. Business, device and industry breakdowns are descriptive; individual effects and subgroup significance were not established. The two-business booking sample and other industry groups are not representative market benchmarks. Results measure recorded enquiries and bookings, rather than revenue, lead quality or search rankings, and are not a forecast for another business.
Frequently Asked Questions
How much can a website redesign improve conversion rates?
Revamp’s 22-business study recorded a 13.5% higher pooled conversion rate on redesigned versions: 3.61% versus 3.18%. Individual changes ranged from -2.4% to +34.4%, with higher recorded rates at 20 of 22 businesses. The methodology explains the observation period and calculation.
What counts as a website conversion in this study?
A recorded completed enquiry or confirmed booking, defined separately for each business. The study counts the completed action, rather than a page view, button click or form start.
Is a 13.5% increase the same as 13.5 percentage points?
No. The rates differed by approximately 0.43 percentage points. Dividing that difference by the existing rate of approximately 3.18% gives a relative increase of 13.5%. All calculations use unrounded values.
Build what your business needs. Keep improving it.
- Start with your existing website or create something new from your idea
- Add pages, forms, bookings, payments and other business features by chatting
- Publish on your own domain and keep improving everything in one workspace
More Guides
Website Trust Statistics: Design, Reviews & Contact (2026)
Website trust statistics from Revamp's internal analysis of 2,367 page ratings. Compare design, reviews and contact details, with methods and limitations.
Mobile vs. Desktop Usability: Booking and Enquiry Benchmarks (2026)
Revamp’s 2026 booking and enquiry benchmarks: 4,584 mobile and desktop task attempts across 48 US service-business websites, with times and form errors.
Website First-Impression Statistics: 500-Person Study (2026)
Revamp's 2026 five-second study of 500 US participants and 50 pre-redesign business homepages: business recognition, offer comprehension and CTA recall.