AI vs. Manual Website Creation Statistics (2026)
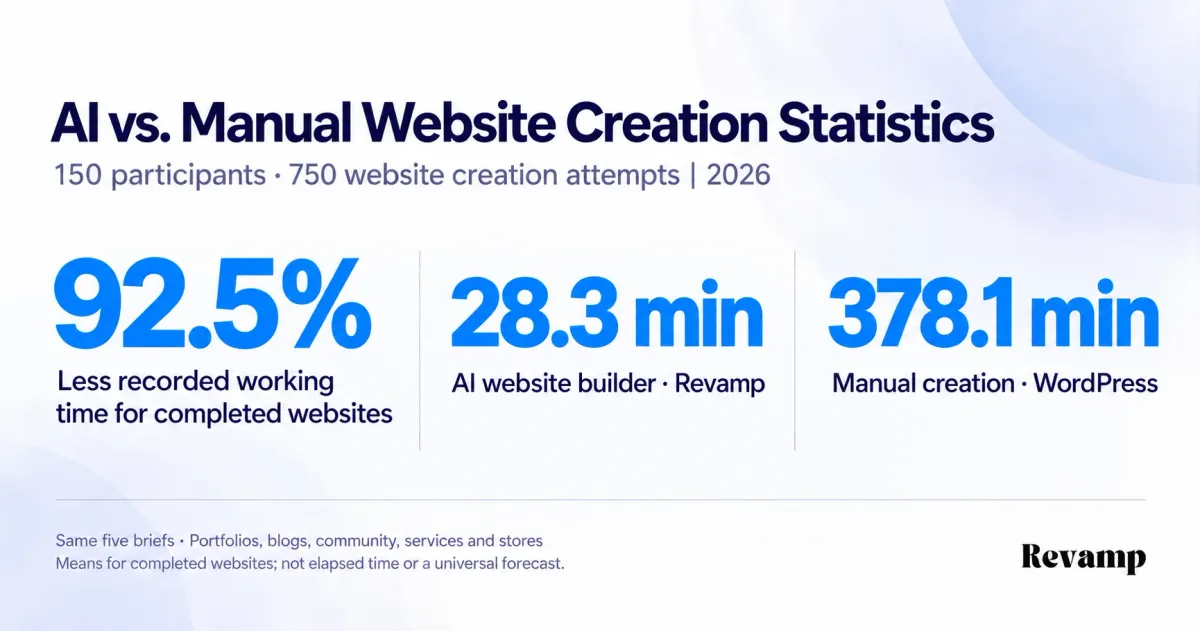
92.5% less recorded working time for completed websites created with AI. Compare AI and manual website creation across 150 participants and 750 attempts.
Introduction
Creating a website with AI took 92.5% less recorded working time than building one manually, among completed websites. In Revamp’s internal study, participants averaged 28.3 minutes using an AI website builder versus 378.1 minutes creating a website manually. Across all attempts, 91.2% of websites were completed with AI, compared with 27.2% manually.
These AI vs. manual website creation statistics cover 150 participants and 750 website creation attempts across portfolios, blogs, community websites, service websites and online stores. Participants used Revamp as their AI website builder or created websites manually in WordPress, with the same five briefs in both groups.
The comparison goes beyond generating a first page. Completion required the brief’s pages, content, working interactions, mobile checks and publication. Quality assessments and subsequent editing tasks examine what happened after a website was finished. Methodology and sources explain the measurement definitions and record corrections.
For the separate spending question, our website cost benchmarks compare Revamp with commissioned agency development and ongoing support, without converting these timings into assumed cash savings.
Key Takeaways
- 92.5% less recorded working time for completed websites: 28.3 minutes on average using an AI website builder, versus 378.1 minutes creating a website manually.
- 91.2% versus 27.2% completion: 342 of 375 website creation attempts with AI were completed, compared with 102 of 375 manual attempts, a difference of 64.0 percentage points.
- Higher assessed quality among completed websites: 6.13 with AI versus 4.03 manually out of seven across visual quality, readability, consistency and mobile presentation.
- All five website types: completion with AI ranged from 88.0% for blogs to 93.3% for stores. Manual completion ranged from 20.0% for stores to 40.0% for community websites.
- Less time spent on later changes: changing the visual direction took a median 8.0 minutes per AI editing attempt, compared with 74.9 minutes manually.
- Fewer website creation sessions needed help: 30.9% of sessions using an AI website builder recorded assistance, compared with 82.1% of manual sessions.
Explore the findings
- Working time
- Completion and unfinished attempts
- Five website types
- Assessed design quality
- Editing after completion
- Prior experience
- Assistance and corrections
- Uncertainty
- Practical implications
- Methodology and sources
1. Creating websites with AI took 92.5% less recorded working time
For completed websites, participants averaged 28.3 active minutes using an AI website builder, compared with 378.1 active minutes creating a website manually. Active time includes the work of creating, correcting, checking and publishing; it excludes breaks and support waiting.
| Completed-website measure | AI website builder (Revamp) | Manual website creation (WordPress) |
|---|---|---|
| Completed websites | 342 | 102 |
| Mean recorded active minutes | 28.3 | 378.1 |
| Median recorded active minutes | 25.6 | 354.4 |
The 92.5% difference is calculated from unrounded means: one minus the mean time with AI divided by the mean time manually. It compares completed websites in each group, not matched pairs of websites built by the same person.
Unfinished attempts also consumed time. Including every attempt gives a different measure: recorded effort spent per attempt, whether or not a website was finished.
| All-attempts measure | AI website builder (Revamp) | Manual website creation (WordPress) |
|---|---|---|
| Website creation attempts | 375 | 375 |
| Mean recorded active minutes, uncapped | 28.0 | 397.5 |
| Mean active minutes with a 540-minute analysis cap | 28.0 | 376.9 |
The uncapped all-attempts comparison is 92.9% lower recorded effort with AI. Applying a 540-minute cap gives 92.6%. The capped result is a sensitivity calculation, not a correction to the original time records. Neither all-attempts average should be described as the time needed to finish a website, because it includes unfinished work.
2. Website completion reached 91.2% with AI, versus 27.2% manually
Of 375 website creation attempts per workflow, 342 websites created with AI and 102 websites built manually passed every acceptance requirement and were recorded as published. The completion-rate difference was 64.0 percentage points.
| Recorded outcome | AI website builder (Revamp) | Manual website creation (WordPress) |
|---|---|---|
| Completed | 342 | 102 |
| Failed to meet requirements | 15 | 114 |
| Abandoned | 18 | 145 |
| Recorded as timed out | 0 | 14 |
| Total attempts | 375 | 375 |
| Completion rate | 91.2% | 27.2% |
The practical distinction is between producing a design and finishing the required website. An online store had to pass its cart and test-checkout requirements; a blog needed its article pages, categories and search. All briefs included a mobile check.
Time and completion belong together. A workflow can look quick if users stop early, so a short average on its own does not establish successful delivery.
3. Website completion was higher with AI across all five website types
Each website brief was attempted 75 times per workflow. Completion with an AI website builder was higher for every brief, with the largest completion-rate difference on the online-store brief.
| Website type | Completed / attempted with AI | Completed / attempted manually | Completion with AI | Completion manually |
|---|---|---|---|---|
| Portfolio | 69 / 75 | 22 / 75 | 92.0% | 29.3% |
| Blog / Publication | 66 / 75 | 16 / 75 | 88.0% | 21.3% |
| Informational / Community | 69 / 75 | 30 / 75 | 92.0% | 40.0% |
| Business / Service | 68 / 75 | 19 / 75 | 90.7% | 25.3% |
| Online Store | 70 / 75 | 15 / 75 | 93.3% | 20.0% |
Stores took the most recorded working time among completed websites created with AI, but also had the highest completion rate with AI. Complexity and completion are different measurements.
| Website type | Median active minutes with AI, completed websites | Median active minutes manually, completed websites |
|---|---|---|
| Portfolio | 23.9 | 366.3 |
| Blog / Publication | 30.6 | 378.9 |
| Informational / Community | 18.0 | 259.8 |
| Business / Service | 26.6 | 434.9 |
| Online Store | 33.3 | 485.3 |
These are results for one defined brief per category, not a timetable for every possible website. A larger publication, a complex store or a custom application can require substantially different work.
4. Websites created with AI averaged 6.13 out of seven for assessed quality
Three reviewer assessments scored each completed website across four dimensions. The overall mean was 6.13 for websites created with AI and 4.03 for websites built manually, a 2.10-point difference on a seven-point scale.
| Quality dimension, seven-point scale | AI website builder (Revamp) | Manual website creation (WordPress) |
|---|---|---|
| Visual quality | 6.19 | 3.91 |
| Readability | 6.07 | 4.56 |
| Consistency | 6.16 | 4.07 |
| Mobile presentation | 6.11 | 3.60 |
| Overall mean | 6.13 | 4.03 |
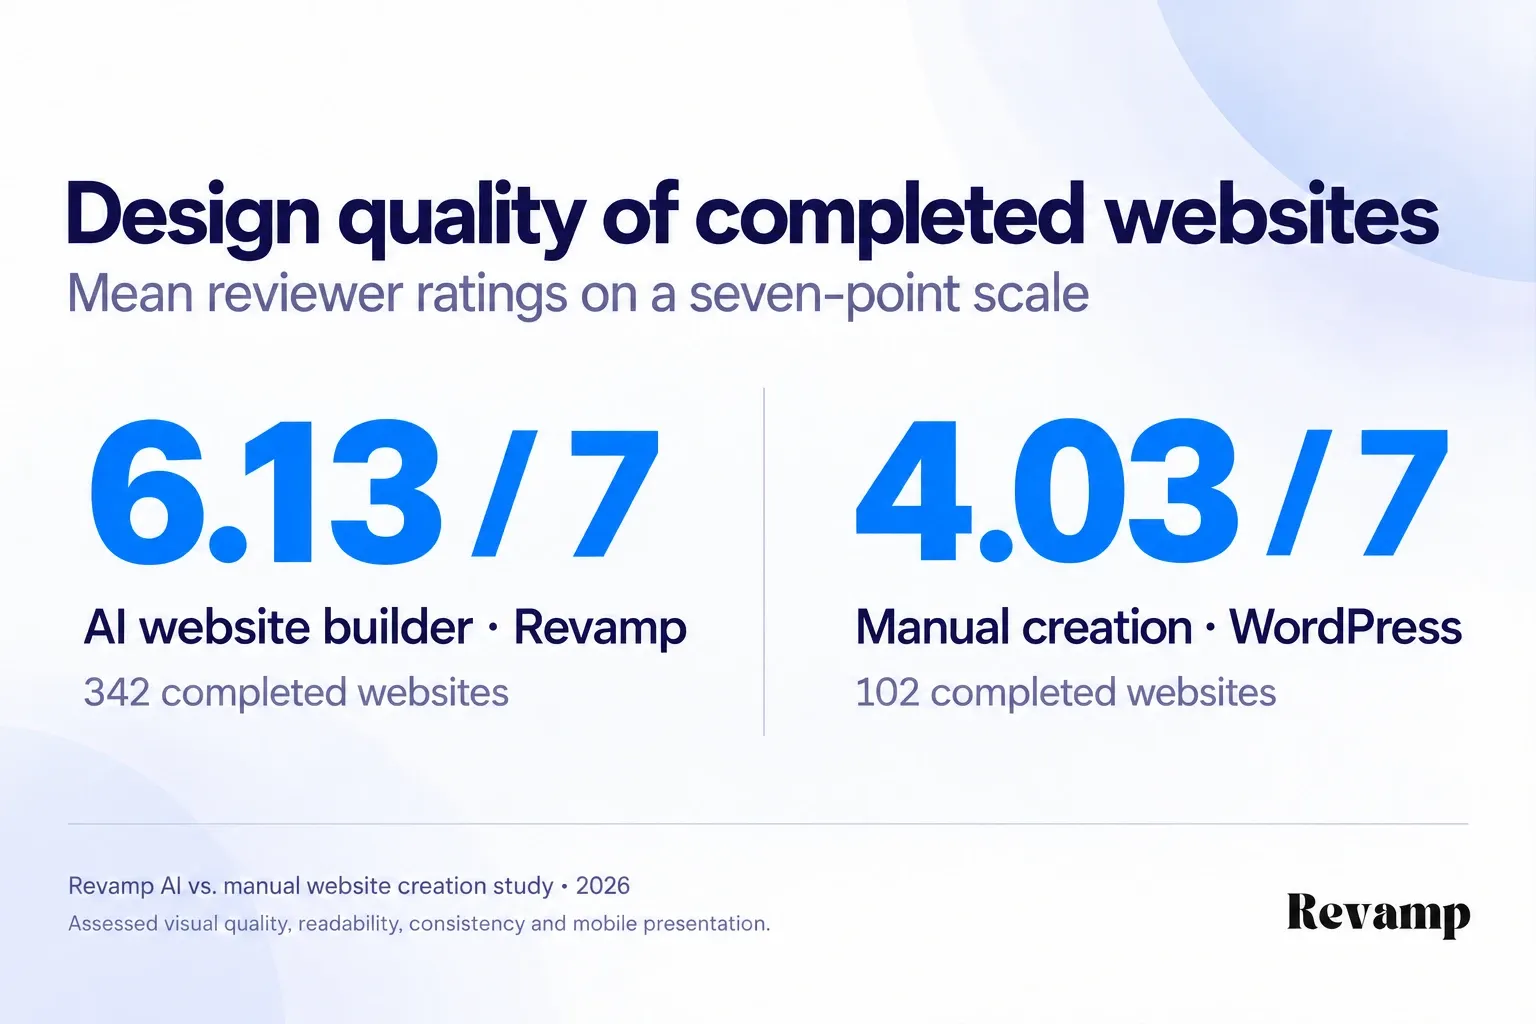
The largest difference was in mobile presentation: 2.51 points. Readability had the smallest difference, at 1.52 points. This matters when judging a quickly created website: its pages must still be readable, coherent and usable on a phone.
Quality ratings cover the 444 completed websites, not all 750 attempts. They describe reviewer assessments, not visitor conversion rates or a universal ranking of the platforms.
5. Changing the visual direction took a median eight minutes with AI
Participants with completed websites attempted two subsequent changes: change the visual direction, then add a page or feature and connect it to the website. The analysis covers 888 editing attempts, including unsuccessful edits.
| Editing task | Median minutes with AI | Median minutes manually | Successful edits with AI | Successful edits manually |
|---|---|---|---|---|
| Change visual direction | 8.0 | 74.9 | 93.3% | 76.5% |
| Add a page or feature and link it into the site | 20.1 | 154.9 | 92.4% | 77.5% |
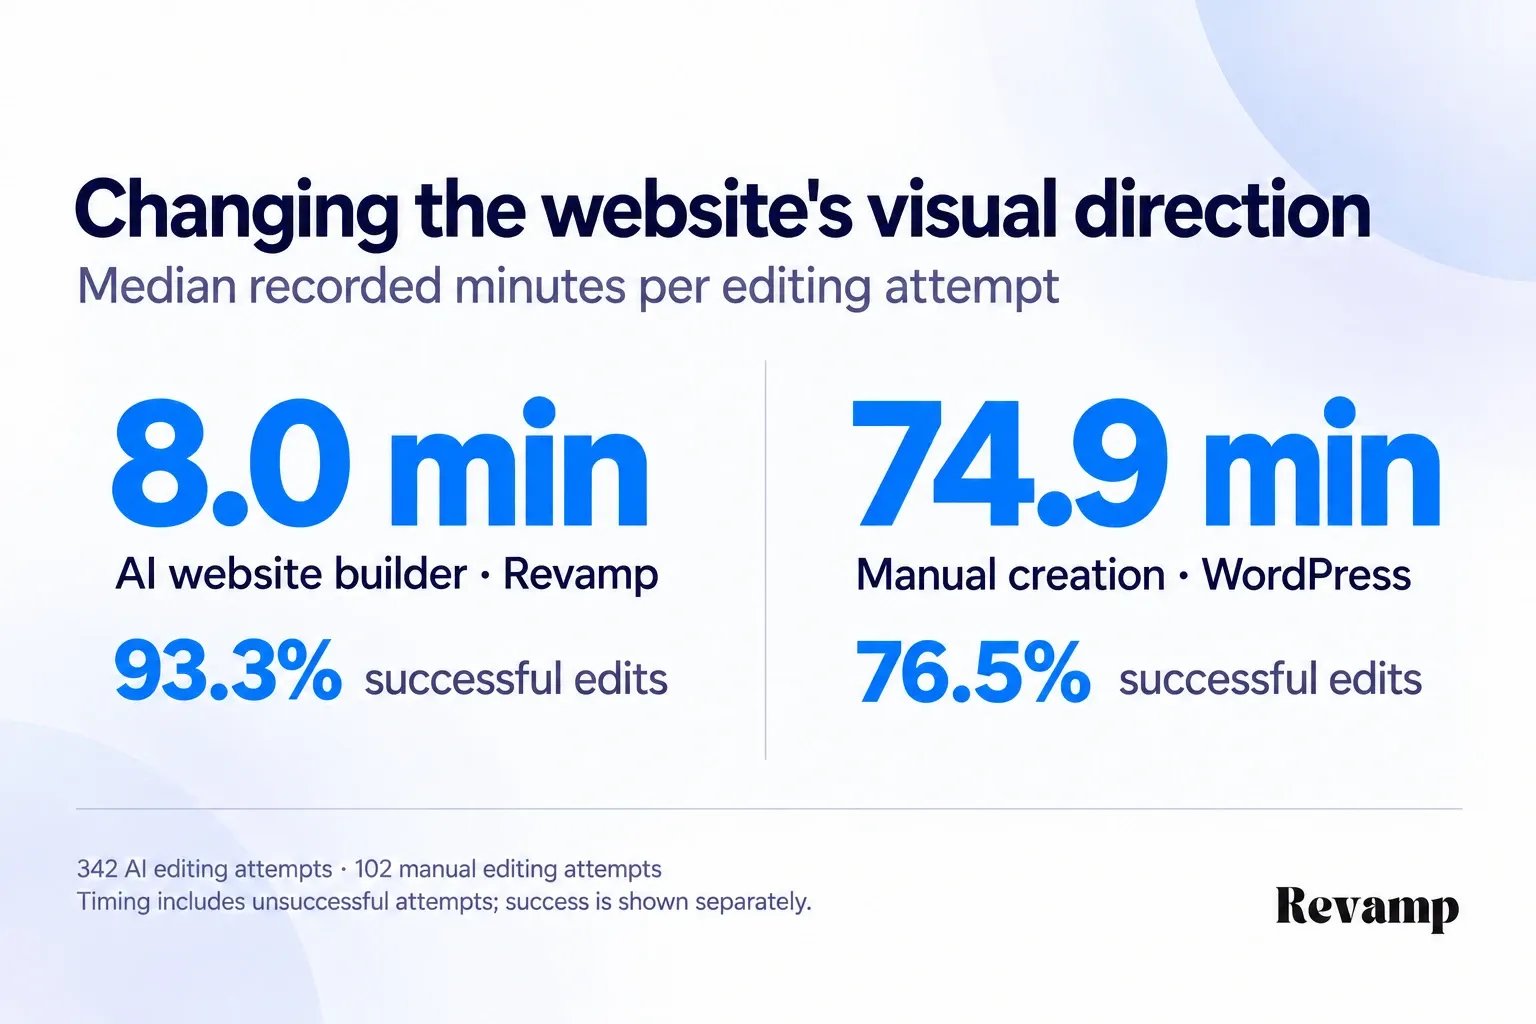
Each task had 342 editing attempts using Revamp’s AI website builder and 102 editing attempts in WordPress. The medians measure time spent per editing attempt, not time to a successful edit only. Success is shown separately.
Creating the first version is only part of website ownership. Changing typography, revising a layout or adding a new service should be considered when comparing workflows, alongside initial build time.
6. First-time users had a 91.4% website completion rate with AI
The novice group had never built a website; the experienced group had built at least one. Both experience groups recorded higher completion using an AI website builder.
| Prior website-building experience | Completed / attempted with AI | Completed / attempted manually | Completion with AI | Completion manually |
|---|---|---|---|---|
| Novice | 192 / 210 | 40 / 200 | 91.4% | 20.0% |
| Experienced | 150 / 165 | 62 / 175 | 90.9% | 35.4% |
There were 42 novice and 33 experienced participants in the AI group, and 40 novice and 35 experienced participants in the manual group. Each attempted five briefs.
Manual website completion was higher among experienced users than novices. Completion with an AI website builder was similar across the two experience groups. The study concerns intended website users, not a comparison against professional development teams.
7. Fewer website creation sessions needed help when using AI
Assistance was recorded in 116 website creation sessions with AI and 308 manual sessions. Correction counts also differed, with sessions using AI averaging 2.7 corrections versus 8.4 manually.
| Measure across all 375 attempts per workflow | AI website builder (Revamp) | Manual website creation (WordPress) |
|---|---|---|
| Sessions with recorded assistance | 116 | 308 |
| Share of sessions with assistance | 30.9% | 82.1% |
| Mean correction count | 2.7 | 8.4 |
These figures describe assistance and rework within the study. They do not mean that every customer will need the same amount of help. They do show why a useful comparison should include the work around the build, not only the first generated page.
8. Participant-level resampling retained the direction of the findings
Each person contributed five attempts. To account for that repeated participation, the reanalysis resampled people with all their attempts kept together, rather than treating 750 attempts as unrelated observations.
| Recorded contrast | Estimate | Exploratory 95% bootstrap interval |
|---|---|---|
| Lower mean active time for completed websites created with AI | 92.5% | 91.8% to 93.2% |
| Website completion-rate advantage with AI | 64.0 percentage points | 58.7 to 68.8 percentage points |
| Quality-score difference among completed websites | +2.10 points | +2.04 to +2.16 points |
These intervals describe variation under resampling of the supplied records. They do not validate the underlying timing records, recover the original analysis plan or establish an expected result for every future user.
Practical implications
Compare website-building workflows on the finished result, not the first screenshot. A useful brief specifies the pages, content, customer actions, mobile behavior and publication requirements before work starts.
For an AI website builder, check whether the workflow lets you continue refining the website after generation. For a manual workflow, include setup, adjustments, functional checks and later edits in the estimate. Time spent solving problems belongs in the comparison too.
For either approach, check the actual journey: navigate the portfolio, search the blog, submit the inquiry or complete the store’s test checkout. A website is not finished simply because its homepage looks finished.
For existing websites, our AI website migration statistics examine modernization across seven legacy technology groups, including functionality, data checks and subsequent editing. Creating a new website and carrying an existing one forward are different jobs.
Methodology and Sources
Research: Revamp’s internal comparison of creating websites with an AI website builder versus creating them manually, reanalysed in October 2026. The analysis uses anonymized session, acceptance-check, reviewer and editing records. Recorded session dates span May to June 2026; the supplied protocol describes a longer May-to-August collection window, which is not reconciled by the available records.
Participants and briefs: 150 analysed participants, 75 per workflow, attempted five briefs each. Another 58 candidate records had no analysed sessions. The briefs cover a portfolio, blog, community website, service website and store. The research protocol describes intended website users and excludes professional web developers. Participants used only their assigned workflow, so this is a between-group comparison, not a same-person speed race.
Platform choice: WordPress represents manual website creation, with a visual page builder, premium theme and store functionality permitted. Revamp represents website creation with an AI website builder, including refinement and publishing. The study compares these implementations, not every manual platform against every AI platform. Exact release versions and settings cannot be verified without the source manifest.
Completion and quality: Completion requires all recorded acceptance checks to pass and publication to be recorded. There are 4,050 acceptance-check rows and 5,328 quality-rating rows, covering 444 completed websites. Each completed website has three reviewer assessments of four dimensions. Blinding varied: 784 rating rows were marked partially blinded, across 380 websites. Quality and editing comparisons concern differently selected completed-website subsets, not every website creation attempt.
Timing corrections: Reanalysis corrected 398 session-level passed-check counts from the individual check rows, without changing observations or completion statuses. The timing tables retain the supplied active-minute values. Calendar timestamps overlap for each participant, so no elapsed-time claim is made. Sixty-eight manual records exceed the protocol’s stated nine-hour limit; uncapped results and a separate 540-minute sensitivity calculation are both shown. Original recordings and referenced screenshots were not supplied for verification.
Calculations: Completion is completed website creation attempts divided by all attempts. Time reduction is one minus the mean time with AI divided by the mean time manually, using unrounded values. Medians are reported separately from means. Quality is the mean of four dimensions and three reviewer assessments per completed website. Editing success is successful edits divided by attempted edits. Displayed figures are rounded only after calculation. Exploratory intervals use 4,000 participant-level bootstrap resamples, with a fixed reproducibility seed; they are retrospective reanalysis, not a verified preregistered result.
Frequently Asked Questions
How long did it take to build a website with AI versus manually?
Among completed websites in this study, mean recorded active working time was 28.3 minutes using an AI website builder and 378.1 minutes creating a website manually. The difference was 92.5%. These are recorded working-time estimates for the study’s five briefs, not guaranteed delivery times for other websites.
Does faster website building mean lower design quality?
Not in the completed websites assessed here. Websites created with AI averaged 6.13 out of seven, compared with 4.03 for websites built manually. Reviewers assessed visual quality, readability, consistency and mobile presentation; the scores are separate from completion and visitor outcomes.
Did the comparison include more than business websites?
Yes. It included a portfolio, blog, community website, service website and online store, with 75 attempts per brief per workflow. The results do not cover every website size or custom web-application requirement.
Build what your business needs. Keep improving it.
- Start with your existing website or create something new from your idea
- Add pages, forms, bookings, payments and other business features by chatting
- Publish on your own domain and keep improving everything in one workspace
More Guides
Website Redesign Conversion Statistics: 22-Business Study (2026)
13.5% higher recorded conversion rates after redesign: website redesign conversion statistics from 496,781 visitors across 22 service businesses.
Website Trust Statistics: Design, Reviews & Contact (2026)
Website trust statistics from Revamp's internal analysis of 2,367 page ratings. Compare design, reviews and contact details, with methods and limitations.
Mobile vs. Desktop Usability: Booking and Enquiry Benchmarks (2026)
Revamp’s 2026 booking and enquiry benchmarks: 4,584 mobile and desktop task attempts across 48 US service-business websites, with times and form errors.