Website First-Impression Statistics: 500-Person Study (2026)
Revamp's 2026 five-second study of 500 US participants and 50 pre-redesign business homepages: business recognition, offer comprehension and CTA recall.
Introduction
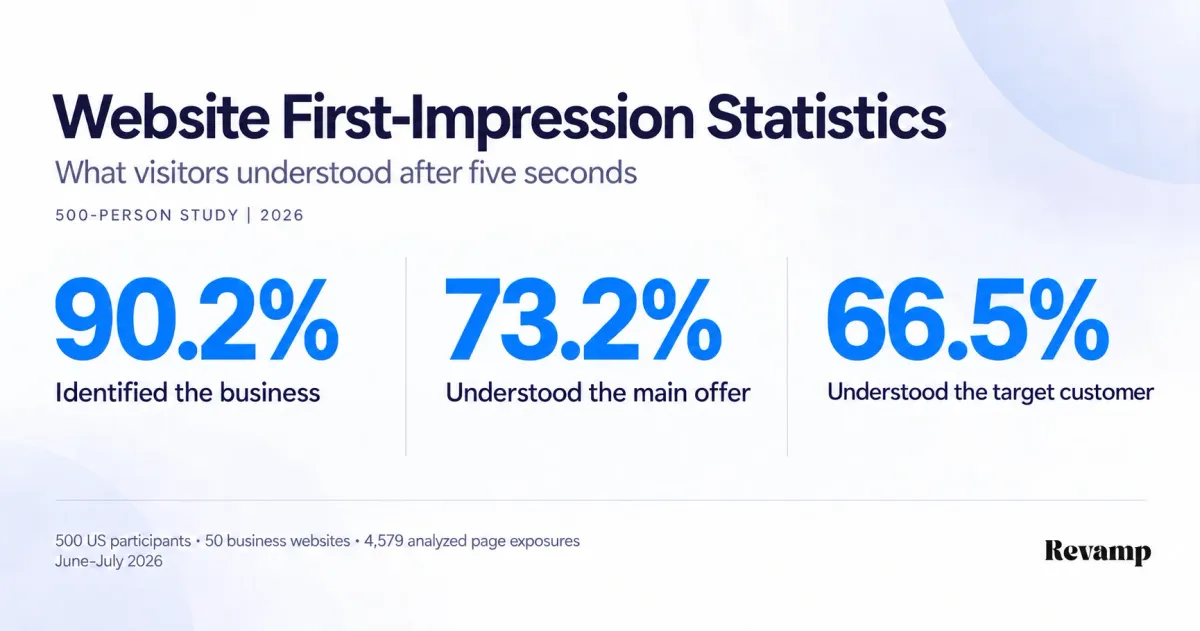
After five seconds, participants correctly identified the kind of business in 90.2% of homepage exposures. They understood its main offer in 73.2% and its target customer in 66.5%. Recognizing the kind of business was not the same as understanding what it sold or who it served.
Revamp’s internal study involved 500 US participants, 50 business websites and 5,000 collected page exposures, recorded during June–July 2026. The main analysis includes 4,579 exposures after exclusions. The test used the original, pre-redesign homepages that businesses submitted to Revamp for redesign. See the methodology.
These are five-second comprehension and recall benchmarks. Participants also reported whether they would continue exploring, but the study did not track actual browsing, bookings or purchases. The results describe the tested sample, rather than all business websites.
Key takeaways
-
Business recognition did not mean complete understanding: the business was identified correctly in 90.2% of exposures (4,129 of 4,579), compared with 73.2% for the main offer (3,351 of 4,579) and 66.5% for the target customer (3,043 of 4,579).
-
An explicit offer was associated with higher comprehension: 81.8% when the offer was stated above the fold (1,720 of 2,103 exposures), versus 65.9% when it was not (1,631 of 2,476). The difference was 15.9 percentage points.
-
Primary-action recall varied by CTA count: 83.7% with one CTA (615 of 735 exposures), 76.8% with two (915 of 1,191), and 60.8% with three or more competing CTAs (1,614 of 2,653).
-
Mobile and desktop results were close: all five headline measures differed by less than one percentage point between the device groups.
-
Willingness to continue: participants said they would keep exploring in 74.8% of analyzed exposures (3,423 of 4,579). This was stated interest, not a conversion rate.
Percentages describe page exposures, not unique people. Multiple exposures came from the same participants and websites. The tables below include exact counts; page-characteristic comparisons describe associations rather than causal effects.
Explore the findings
- Comprehension rates
- Category, offer clarity and visual complexity
- Calls to action
- Mobile vs desktop
- Industry differences
- Participant familiarity
- Location and service-area recall
- Willingness to continue
- Methodology and sources
- Frequently asked questions
1. What visitors understood after five seconds
Business identification had the highest correct-response rate. Understanding the intended customer had the lowest of the four comprehension and recall measures. Participants also reported whether they would continue exploring after the exposure.
| Measure | Responses / exposures | Rate |
|---|---|---|
| Business identified correctly | 4,129 / 4,579 | 90.2% |
| Main offer understood correctly | 3,351 / 4,579 | 73.2% |
| Target customer understood correctly | 3,043 / 4,579 | 66.5% |
| Primary action recalled correctly | 3,144 / 4,579 | 68.7% |
| Would continue exploring | 3,423 / 4,579 | 74.8% |
Business identification exceeded offer comprehension by 17.0 percentage points and target-customer comprehension by 23.7 points. A homepage review focused only on whether someone could identify the business would miss those differences.
One person viewing one homepage counts as one exposure. “Correct” means fully correct; partially correct answers are separate. The same participants viewed multiple websites, so these are descriptive rates for the tested sample. See the methodology.
Business identification, offer comprehension and target-customer comprehension were each scored as correct, partially correct or incorrect. Keeping all three outcomes visible distinguishes incomplete understanding from an incorrect answer.
| Measure | Correct | Partially correct | Incorrect |
|---|---|---|---|
| Business identification | 90.2% 4,129 / 4,579 | 1.2% 56 / 4,579 | 8.6% 394 / 4,579 |
| Main offer | 73.2% 3,351 / 4,579 | 4.9% 223 / 4,579 | 21.9% 1,005 / 4,579 |
| Target customer | 66.5% 3,043 / 4,579 | 5.1% 233 / 4,579 | 28.5% 1,303 / 4,579 |
A partially correct answer is not the same as an incorrect one. Subtracting a fully correct rate from 100% combines both categories; it should not be described as the share that understood nothing.
Confidence in the answers
After identifying the business, participants rated how confident they were on a five-point scale. Correct identifications had a mean confidence of 4.42, compared with 3.24 for incorrect identifications.
| Answer | Responses | Mean confidence |
|---|---|---|
| Correct business identification | 4,129 | 4.42 / 5 |
| Incorrect business identification | 394 | 3.24 / 5 |
Confidence was higher when the answer was correct, but an incorrect answer did not necessarily come with low confidence. This supports checking what a person understood rather than relying only on whether they felt sure. The comparison includes fully correct and incorrect answers; the 56 partially correct identifications are separate.
2. Clear wording and offer comprehension
The study separately coded whether the business category and its main offer were explicitly stated above the fold: the part of the page visible without scrolling. Naming the category and explaining the offer answer different questions.
Participants correctly identified the business in 2,220 of 2,380 exposures to homepages with an explicit category statement. On homepages without one, the corresponding count was 1,909 of 2,199.
| Above-the-fold wording | Websites | Correct / exposures | Rate |
|---|---|---|---|
| Explicitly stated | 26 | 2,220 / 2,380 | 93.3% |
| Not explicitly stated | 24 | 1,909 / 2,199 | 86.8% |
The observed gap was 6.5 percentage points. Category recognition was still relatively high without an explicit statement, but it was higher among pages that named the category directly.
The offer comparison showed a larger gap. Participants correctly understood the main product or service in 1,720 of 2,103 exposures when the offer was explicit above the fold, compared with 1,631 of 2,476 when it was not.
| Above-the-fold wording | Websites | Correct / exposures | Rate |
|---|---|---|---|
| Explicitly stated | 23 | 1,720 / 2,103 | 81.8% |
| Not explicitly stated | 27 | 1,631 / 2,476 | 65.9% |
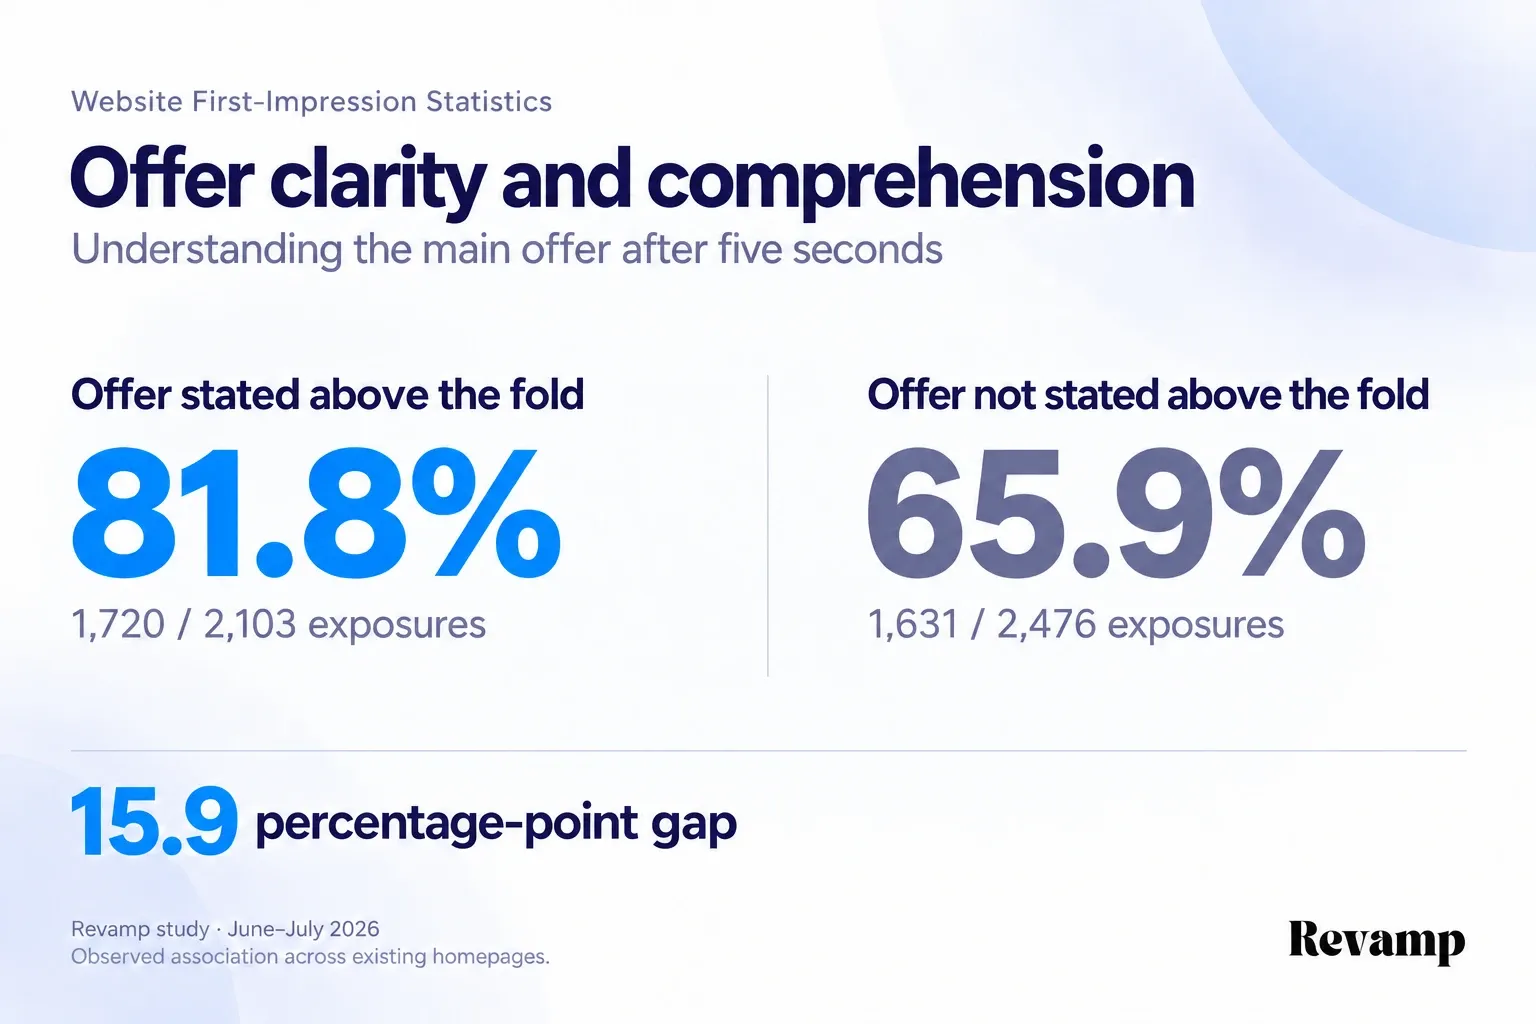
The 15.9-percentage-point difference makes offer clarity a specific question to investigate in a homepage test. It does not mean adding a sentence will automatically deliver that improvement: the two groups also differed in other page characteristics.
Visual complexity and offer comprehension
The website-coding records classify visual complexity as low, medium or high. Offer comprehension ranged from 84.5% in the low-complexity group to 68.7% in the high-complexity group, while business identification remained close to 90% in all three groups.
| Visual complexity | Websites | Business identification | Offer comprehension |
|---|---|---|---|
| Low | 11 | 90.1% 896 / 995 | 84.5% 841 / 995 |
| Medium | 17 | 90.5% 1,400 / 1,547 | 71.8% 1,110 / 1,547 |
| High | 22 | 90.0% 1,833 / 2,037 | 68.7% 1,400 / 2,037 |
The difference was in understanding the offer more than recognizing the category. These are the study’s page-level coding groups, not a universal complexity scale, and other characteristics varied alongside them. The results support testing whether the offer is easy to find and explain; they do not show that a visually simpler redesign will necessarily perform better.
3. Competing calls to action and recall
A call to action, or CTA, is the next step a business asks a visitor to take, such as booking an appointment, requesting a quote or buying a product. The study compared the action each participant recalled with the website’s primary CTA.
Correct recall was lower in each successive CTA-count group: one, two, and three or more competing actions above the fold.
| CTAs | Websites | Correct / exposures | Rate |
|---|---|---|---|
| One | 8 | 615 / 735 | 83.7% |
| Two | 13 | 915 / 1,191 | 76.8% |
| Three or more | 29 | 1,614 / 2,653 | 60.8% |
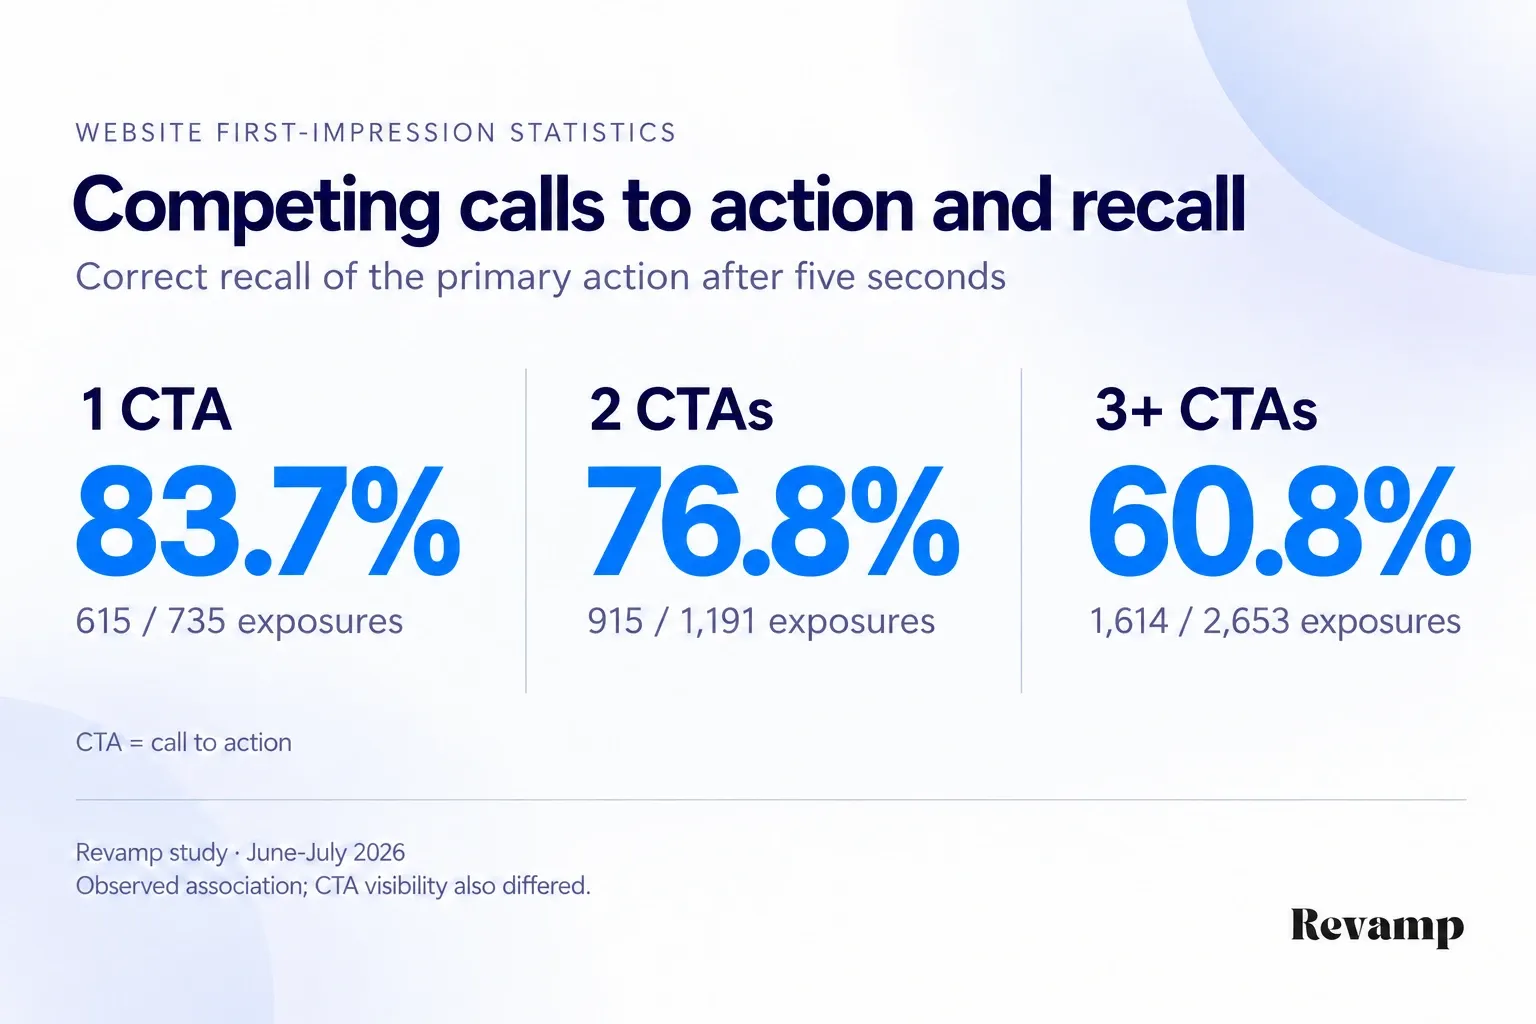
The difference between one CTA and three or more was 22.8 percentage points, calculated from the underlying counts. The two-CTA group fell between them, at 76.8%.
CTA count was not isolated from visibility. All eight one-CTA websites had the primary CTA visible, compared with 17 of the 29 websites with three or more CTAs. The comparison points to the clarity of the next step as a useful test subject. It does not establish a universal rule that every homepage should have only one button.
Participants did not always fail to name an action when they missed the primary CTA. The study distinguished remembering a different action from being unable to name a clear action.
| Response | Responses / exposures | Rate |
|---|---|---|
| Matched the primary action | 3,144 / 4,579 | 68.7% |
| Named a different action | 994 / 4,579 | 21.7% |
| Action was unclear | 441 / 4,579 | 9.6% |
That distinction matters when interpreting the result. The 9.6% unclear-action rate measures something different from all responses that did not match the primary CTA. For a page review, check both whether people can name a next step and whether it is the step the business intended.
4. Mobile and desktop first impressions
The main analysis includes 2,096 mobile exposures from 228 participants and 2,483 desktop exposures from 272 participants. Both device groups viewed all 50 websites across their combined exposures.
None of the five headline measures differed by as much as one percentage point between device groups.
| Measure | Mobile | Desktop |
|---|---|---|
| Business identified correctly | 89.8% 1,882 / 2,096 | 90.5% 2,247 / 2,483 |
| Main offer understood correctly | 73.1% 1,532 / 2,096 | 73.3% 1,819 / 2,483 |
| Target customer understood correctly | 66.8% 1,400 / 2,096 | 66.2% 1,643 / 2,483 |
| Primary action recalled correctly | 68.2% 1,429 / 2,096 | 69.1% 1,715 / 2,483 |
| Would continue exploring | 74.8% 1,568 / 2,096 | 74.7% 1,855 / 2,483 |
This study did not show a large mobile disadvantage in five-second comprehension. Each participant used one device type, however, so this was not a paired test of the same person viewing the same website on both devices. Similar first-impression rates also do not establish similar results for later tasks such as navigation, booking or checkout.
5. Industry differences
The sample covered nine industry groups, with three to eight websites per group. Target-customer comprehension ranged from 53.2% to 77.4%, a wider range than business identification, offer comprehension, action recall or willingness to continue.
The tables show every industry in alphabetical order. Each result includes its percentage, correct-response or positive-response count, exposure denominator.
The first comparison separates recognizing the business from understanding its product or service and intended audience.
| Industry | Websites | Business identification | Offer comprehension | Target customer |
|---|---|---|---|---|
| Automotive services | 5 | 89.9% 420 / 467 | 69.4% 324 / 467 | 69.0% 322 / 467 |
| Beauty, hair & wellness | 6 | 91.4% 502 / 549 | 75.8% 416 / 549 | 74.0% 406 / 549 |
| Fitness & recreation | 3 | 90.0% 243 / 270 | 77.0% 208 / 270 | 77.4% 209 / 270 |
| Health & dental clinics | 7 | 88.7% 565 / 637 | 72.2% 460 / 637 | 73.9% 471 / 637 |
| Home & trade services | 8 | 90.8% 665 / 732 | 75.7% 554 / 732 | 71.2% 521 / 732 |
| Hospitality & accommodation | 5 | 89.7% 408 / 455 | 67.0% 305 / 455 | 53.2% 242 / 455 |
| Professional services | 7 | 87.9% 566 / 644 | 71.4% 460 / 644 | 58.7% 378 / 644 |
| Property & lettings | 4 | 89.3% 327 / 366 | 75.7% 277 / 366 | 59.0% 216 / 366 |
| Retail & ecommerce | 5 | 94.3% 433 / 459 | 75.6% 347 / 459 | 60.6% 278 / 459 |
Business identification exceeded target-customer comprehension in every industry group. Retail and ecommerce illustrates the distinction: business identification was 94.3%, while target-customer comprehension was 60.6%. Recognizing a type of website does not fully answer who its offer is intended for.
The second comparison reports whether participants recalled the intended next action and whether they said they would continue exploring.
| Industry | Websites | Correct action recall | Would continue |
|---|---|---|---|
| Automotive services | 5 | 71.3% 333 / 467 | 75.4% 352 / 467 |
| Beauty, hair & wellness | 6 | 78.3% 430 / 549 | 78.3% 430 / 549 |
| Fitness & recreation | 3 | 71.1% 192 / 270 | 77.4% 209 / 270 |
| Health & dental clinics | 7 | 69.1% 440 / 637 | 73.0% 465 / 637 |
| Home & trade services | 8 | 66.8% 489 / 732 | 75.1% 550 / 732 |
| Hospitality & accommodation | 5 | 66.8% 304 / 455 | 73.8% 336 / 455 |
| Professional services | 7 | 62.0% 399 / 644 | 74.2% 478 / 644 |
| Property & lettings | 4 | 57.9% 212 / 366 | 68.0% 249 / 366 |
| Retail & ecommerce | 5 | 75.2% 345 / 459 | 77.1% 354 / 459 |
These measures answer different questions. A person can express interest without correctly naming the primary CTA, and the industry-level percentages do not reveal why. Because each group contains only a small set of websites, the results describe those tested pages rather than an industry-wide quality ranking.
6. Industry familiarity and comprehension
Participants reported their prior industry familiarity as “not at all,” “slightly,” “moderately” or “very.” Offer comprehension was higher in the more familiar groups, rising from 65.8% to 79.3% between the two endpoints.
| Familiarity | Participants | Business identification | Offer comprehension | Correct action recall |
|---|---|---|---|---|
| Not at all | 78 | 88.5% 624 / 705 | 65.8% 464 / 705 | 67.9% 479 / 705 |
| Slightly | 157 | 89.1% 1,297 / 1,456 | 70.3% 1,023 / 1,456 | 68.6% 999 / 1,456 |
| Moderately | 179 | 92.0% 1,500 / 1,631 | 76.0% 1,240 / 1,631 | 67.1% 1,095 / 1,631 |
| Very | 86 | 90.0% 708 / 787 | 79.3% 624 / 787 | 72.6% 571 / 787 |
The offer-comprehension gap was 13.5 percentage points. For a business testing its homepage, this is a reason to include people unfamiliar with its field, not just knowledgeable colleagues or regular customers.
Industry familiarity is distinct from familiarity with the tested brand: known-brand exposures were excluded. The industry-familiarity label was recorded at participant level, not separately for every website or industry they encountered.
7. Location and service-area recall
Location or service-area recall was scored only when geography mattered to the business and the information was visible above the fold. That subset comprised 2,203 exposures across 24 websites.
Participants correctly recalled the location in 1,614 of those exposures.
| Location response | Responses / scored exposures | Rate |
|---|---|---|
| Correct | 1,614 / 2,203 | 73.3% |
| Incorrect | 589 / 2,203 | 26.7% |
A further 1,003 analyzed exposures across 11 websites involved geography-relevant businesses whose location information was not visible in the coded first view. Those exposures were not counted as location-recall failures. Another 1,373 exposures involved businesses where geography was not considered relevant.
The result therefore describes recall of relevant, visible location information. It does not measure location recall across all 50 websites. For a local or service-area business, a homepage test should first check whether the geography is available in the initial view, then whether people remember it.
8. Would visitors keep exploring?
Participants said they would continue exploring in 3,423 of 4,579 analyzed exposures. They said they would not continue in 1,156 exposures, or 25.2%.
| Stated intention | Responses / exposures | Rate |
|---|---|---|
| Would continue exploring | 3,423 / 4,579 | 74.8% |
| Would not continue exploring | 1,156 / 4,579 | 25.2% |
This is a stated intention under test conditions. It is not an observed continuation rate, bounce rate or conversion rate. The finding describes initial interest; the study did not track whether participants later clicked, contacted the business, booked or bought.
What these findings mean for businesses
The central lesson is to test recognition, offer comprehension, audience comprehension and the next action separately. A recognizable business can still receive weaker results on the other questions.
Test the offer, not just the category. Ask someone what the business sells or provides after the five-second view. Compare the answer with the intended offer before explaining it. This addresses the distinction between the study’s business-identification and offer-comprehension results.
Check which action people remember. Ask what the page wanted them to do next. A response naming the wrong action calls for a different investigation from a response that names no action at all. Review the relative visibility and wording of the intended CTA alongside competing actions.
Include people who do not already know the answer. Familiar colleagues may not reveal the same misunderstandings as people new to the industry. For geographically limited services, also ask where the business operates or whom it can serve.
These are follow-up testing recommendations, not changes evaluated in this study. Measure the outcome relevant to the change: comprehension for a messaging test, and observed leads, bookings or purchases for a conversion test.
Methodology and sources
Source: Revamp’s internal five-second website first-impression study of original, pre-redesign homepage screenshots submitted for redesign. This article reports anonymized, aggregate results; participant and website identities are not disclosed.
Revamp conducted the study during June 1–July 31, 2026, using 500 US participants and 50 original, pre-redesign homepages randomly selected from websites submitted to Revamp for redesign. Participants were in age bands from 18–24 through 65+.
Each participant saw 10 different homepages for exactly five seconds each, with randomized presentation order, then answered questions about the business, offer, audience, primary action, location and willingness to continue. No participant saw the same website twice.
| Study detail | Count or period |
|---|---|
| Fieldwork | June 1–July 31, 2026 |
| US participants | 500 |
| Unique business websites | 50 |
| Industries represented | 9 |
| Page exposures collected | 5,000 |
| Unique exposures excluded | 421 |
| Page exposures analyzed | 4,579 |
| Exposure duration | 5 seconds |
| Different homepages viewed per participant | 10 |
| Collected exposures per website | 100 |
| Analyzed exposures per website | 87–96 |
Exposure counts were balanced at collection: each website received exactly 100 views. After exclusions, website contributions ranged from 87 to 96 analyzed exposures. All 500 participant IDs and all 50 website IDs remain represented in the main analysis. Participants, unique websites and page exposures are separate sample counts.
Business identification, main-offer comprehension and target-customer comprehension were scored as correct, partially correct or incorrect. The headline rates count only fully correct responses. The complete scoring distributions appear with the comprehension results.
Primary-action recall was matched to the website’s coded primary CTA. Location was scored only where it was relevant and visible. The overall offer-comprehension result includes all eligible responses: 3,805 were marked unprompted and 774 were not. It is therefore not presented as an exclusively unprompted-recall measure.
The main analysis excludes exposures flagged for prior brand familiarity, screenshot failure, incomplete sessions or implausibly fast responses. The resulting exclusion count is 421 unique exposures.
| Recorded reason | Exposures flagged |
|---|---|
| Prior familiarity with the tested brand | 327 |
| Screenshot failure | 64 |
| Incomplete session | 32 |
| Implausibly fast response | 4 |
| Any reason: unique excluded exposures | 421 |
Reasons can overlap, so adding the individual reason counts would overstate the number removed. The analysis applies the study’s exposure-level exclusion rules rather than removing every observation from a participant whenever any record is flagged.
Two independent reviewers classified the open-text answers, with disagreements resolved before analysis. The study’s recorded reviewer agreement was 4,462 of 5,000 double-coded exposures: 89.2%.
Rates are pooled proportions of analyzed exposures. Numerators, denominators and percentages in this article are calculated from the anonymized exposure-level records and linked website and participant coding. Percentages are rounded to one decimal place. Percentage-point differences use the unrounded proportions, so subtracting the displayed rounded percentages can sometimes give a slightly different answer.
The same participants viewed multiple websites, and each website was viewed repeatedly. The rates are descriptive; no exposure-level confidence intervals are presented as margins of error for US visitors or business websites.
The websites came from businesses already submitted for redesign. Random selection within that intake does not make the sample representative of all business websites. Industry comparisons are based on three to eight websites each.
Page characteristics, including explicit category wording, offer wording, CTA count and visual complexity, were coded at website level. The comparisons are observational associations, not randomized tests of different versions of the same page. Website-level coding also does not capture every variation in viewport, screen size or zoom.
Five-second exposure is a controlled test, not unrestricted browsing. The study measures comprehension, recall, confidence and stated willingness to continue. It does not measure how quickly an aesthetic judgment first forms, trust, actual conversions or before-and-after redesign performance.
Primary source: Revamp’s 2026 five-second website first-impression study. Revamp collected the research and also offers website creation and redesign products. Participant and website identities are anonymized in the analysis.
Frequently asked questions
What can visitors understand about a business website in five seconds?
In Revamp’s 2026 study, participants correctly identified the business in 90.2% of analyzed exposures (4,129 of 4,579), understood its main offer in 73.2% (3,351 of 4,579), and understood its target customer in 66.5% (3,043 of 4,579). Recognizing the business did not mean the offer and audience were equally clear. See the comprehension results.
How did offer wording relate to comprehension?
Offer comprehension was 81.8% on homepages where the main offer was explicit above the fold (1,720 of 2,103 exposures), compared with 65.9% where it was not (1,631 of 2,476). The 15.9-percentage-point difference describes different existing websites, not the effect of adding or rewriting a headline. See the offer comparison.
Are fewer calls to action associated with better recall?
Yes, in this sample. Correct primary-action recall was 83.7% with one CTA (615 of 735 exposures), 76.8% with two (915 of 1,191), and 60.8% with three or more (1,614 of 2,653). CTA visibility also differed between the groups, so the comparison does not isolate the effect of CTA count. See the CTA results.
Were mobile first impressions worse than desktop?
The observed device differences were small: none of the five headline rates differed by as much as one percentage point. For example, offer comprehension was 73.1% on mobile (1,532 of 2,096 exposures) and 73.3% on desktop (1,819 of 2,483). Different participants used the two device types. See the device comparison.
Is willingness to continue a conversion or bounce rate?
No. Participants said they would continue exploring in 74.8% of analyzed exposures (3,423 of 4,579). That measures stated intention after a five-second view, not observed browsing, a lead, a booking or a purchase. Similarly, the 25.2% who said they would not continue (1,156 of 4,579) do not constitute a measured bounce rate. See the willingness-to-continue results.
How many people and websites were included in the study?
The study involved 500 US participants and 50 business websites. Each participant saw 10 different homepages, producing 5,000 collected exposures. After 421 exposure-level exclusions, the main analysis contained 4,579 exposures, with all 500 participant IDs and all 50 websites still represented. See the methodology.
Can this study predict the benefit of redesigning a website?
No. The study did not compare before-and-after redesigns or test randomized page variants. Its results identify questions worth investigating, such as whether visitors understand the offer or remember the intended action. They do not predict a comprehension or conversion improvement for a particular website.
Build what your business needs. Keep improving it.
- Start with your existing website or create something new from your idea
- Add pages, forms, bookings, payments and other business features by chatting
- Publish on your own domain and keep improving everything in one workspace
More Guides
Mobile vs. Desktop Usability: Booking and Enquiry Benchmarks (2026)
Revamp’s 2026 booking and enquiry benchmarks: 4,584 mobile and desktop task attempts across 48 US service-business websites, with times and form errors.
Website Trust Statistics: Design, Reviews & Contact (2026)
Website trust statistics from Revamp's internal analysis of 2,367 page ratings. Compare design, reviews and contact details, with methods and limitations.
Website Redesign Conversion Statistics: 22-Business Study (2026)
13.5% higher recorded conversion rates after redesign: website redesign conversion statistics from 496,781 visitors across 22 service businesses.